 3
3peptides
spectra

0.519 | 0.624
0.023 | 0.138
0.000 | 0.135
0.000 | 0.087
0.000 | 0.000
0.199 | 0.323
0.000 | 0.000
0.000 | 0.000
1peptide
spectra
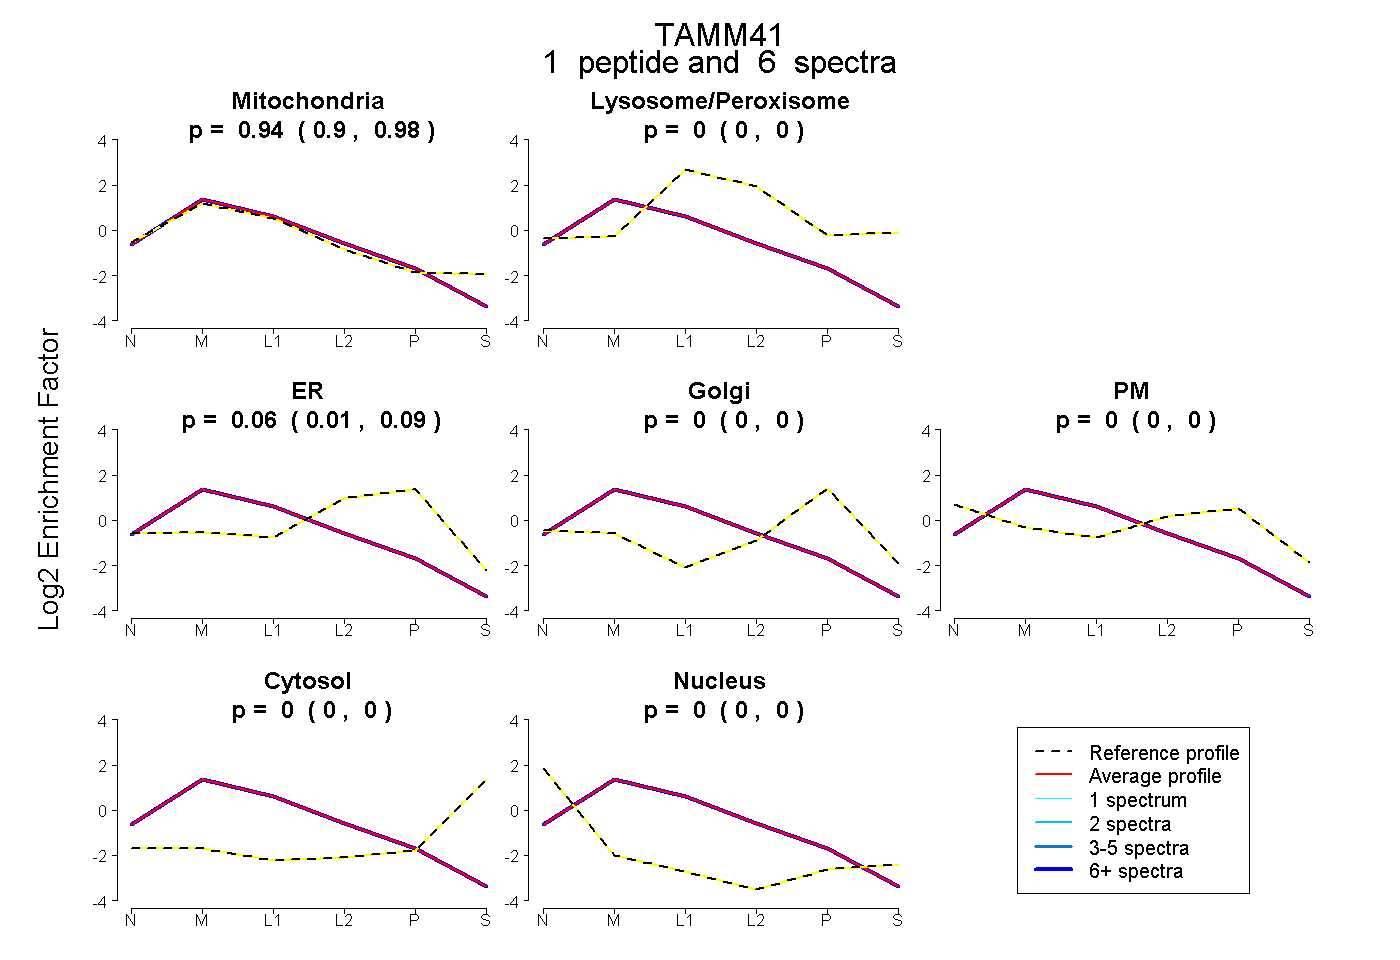
0.898 | 0.978
0.000 | 0.000
0.014 | 0.094
0.000 | 0.000
0.000 | 0.000
0.000 | 0.000
0.000 | 0.000
9peptides
spectra
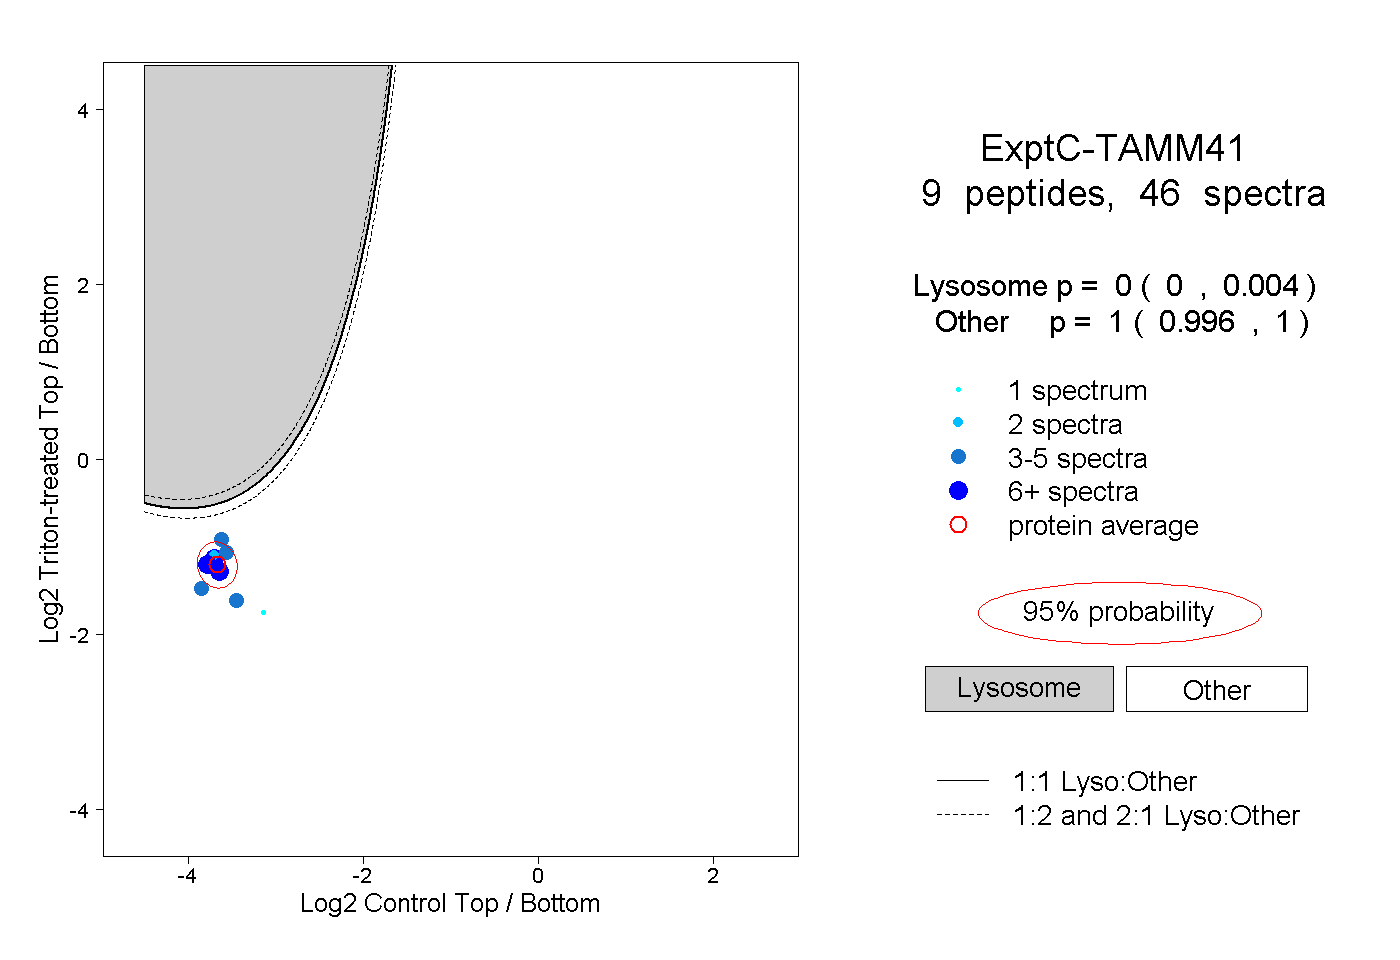
0.000 | 0.004
0.996 | 1.000
1peptide
spectra
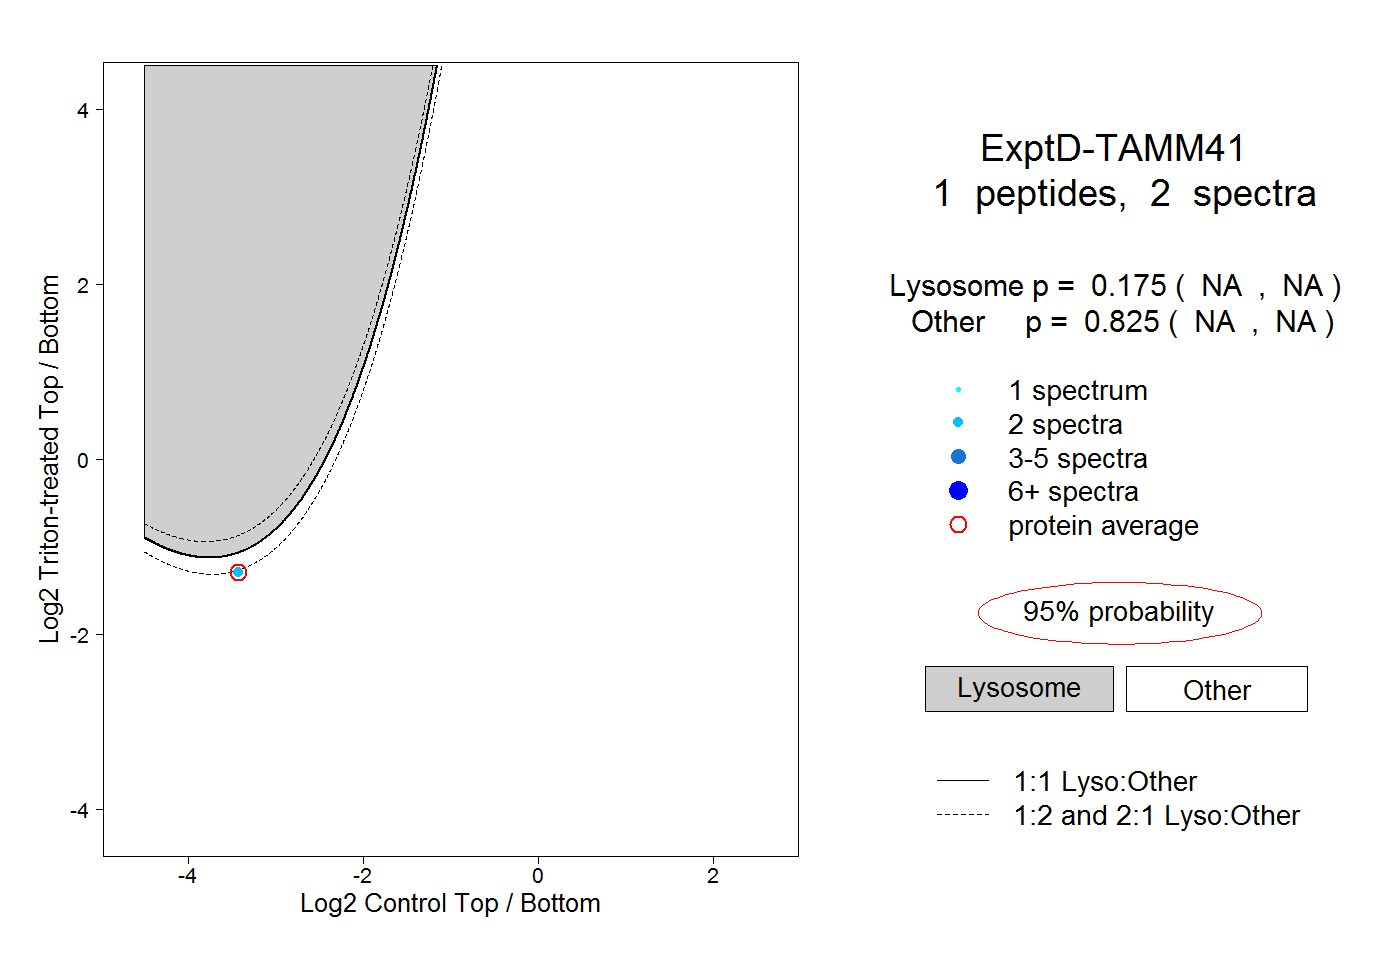
NA | NA
NA | NA