 22
22peptides
spectra
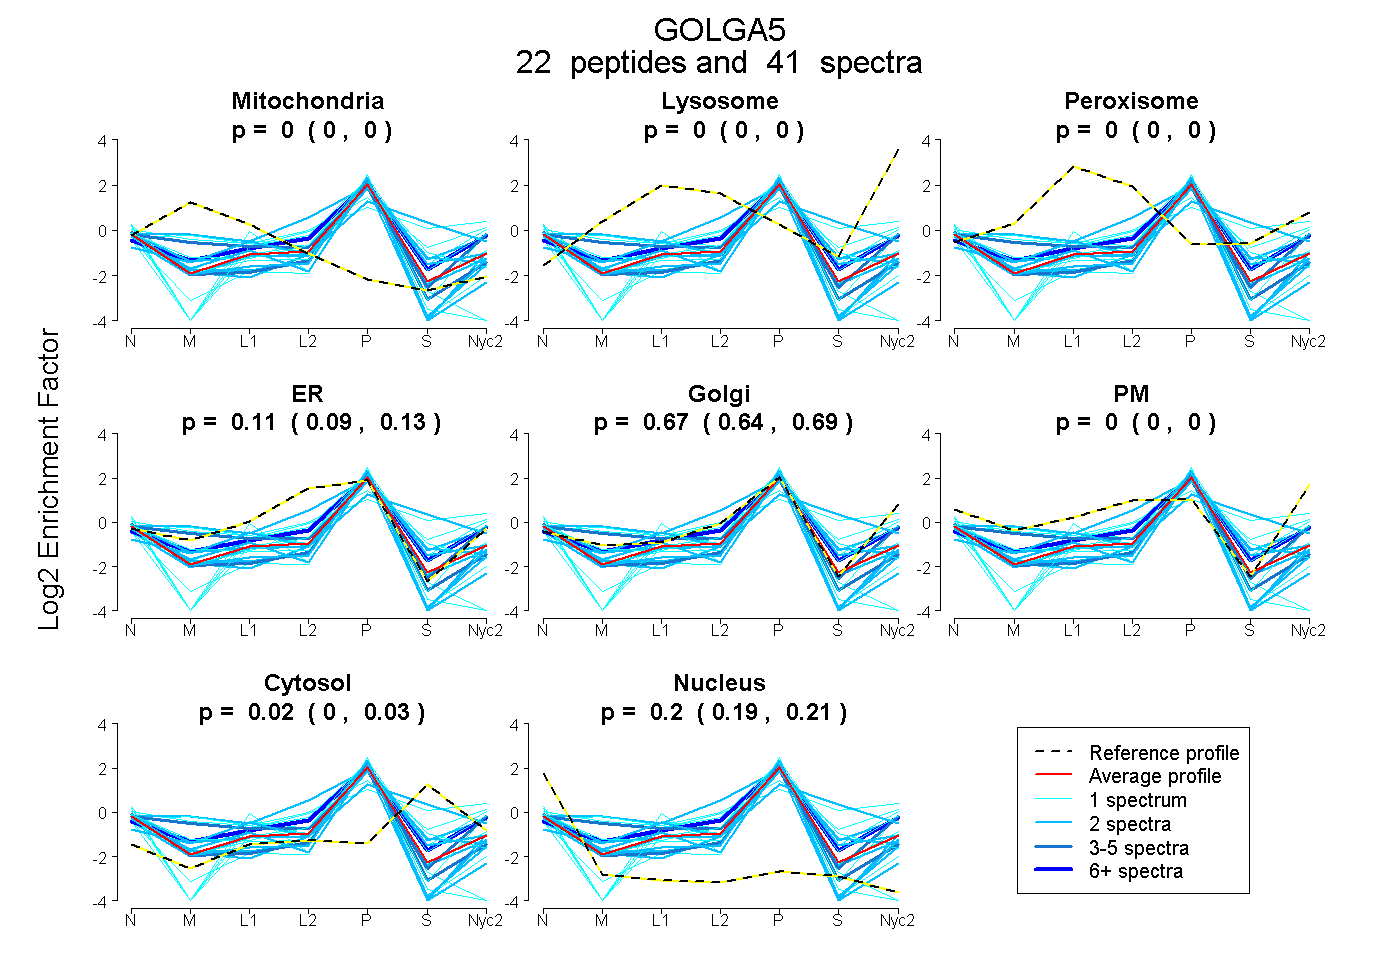
0.000 | 0.000
0.000 | 0.000
0.000 | 0.000
0.092 | 0.133
0.638 | 0.688
0.000 | 0.000
0.001 | 0.031
0.193 | 0.209
4peptides
spectra
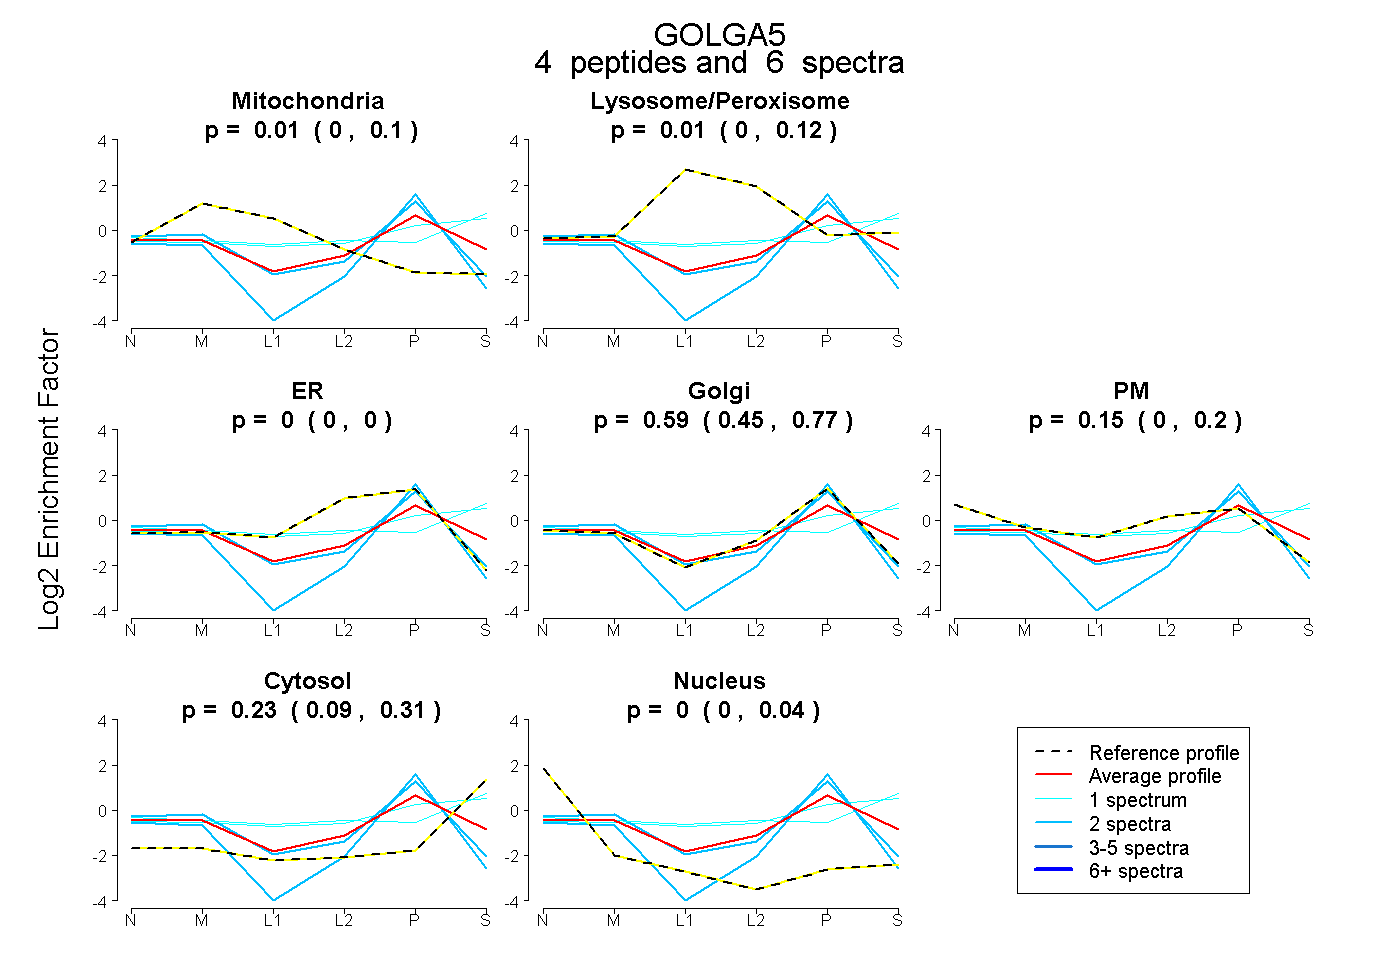
0.000 | 0.103
0.000 | 0.117
0.000 | 0.000
0.453 | 0.772
0.000 | 0.198
0.093 | 0.311
0.000 | 0.043
5peptides
spectra
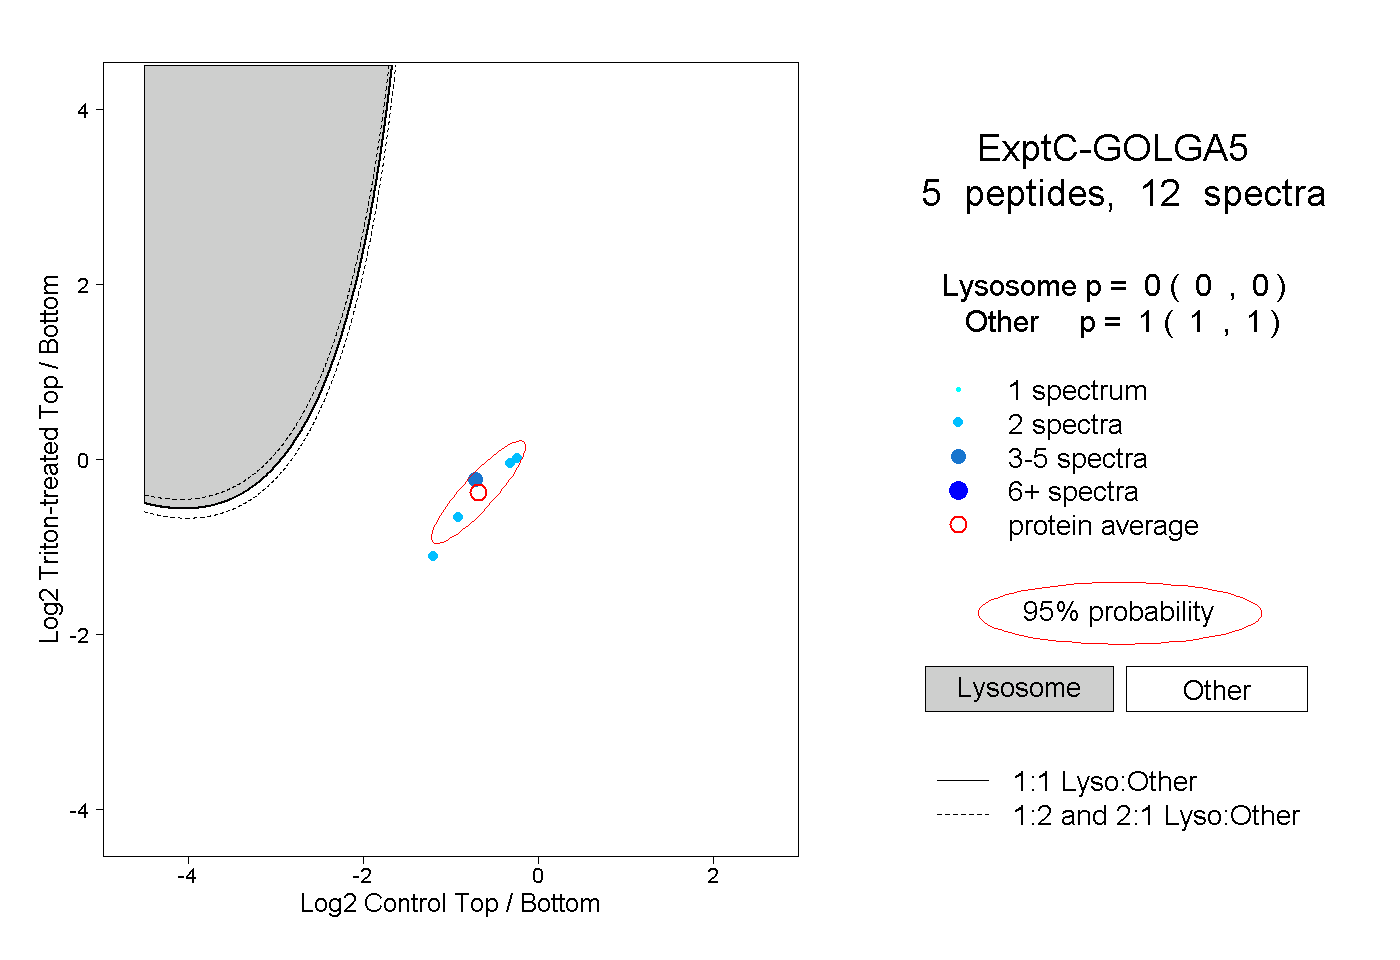
0.000 | 0.000
1.000 | 1.000