 2
2peptides
spectra
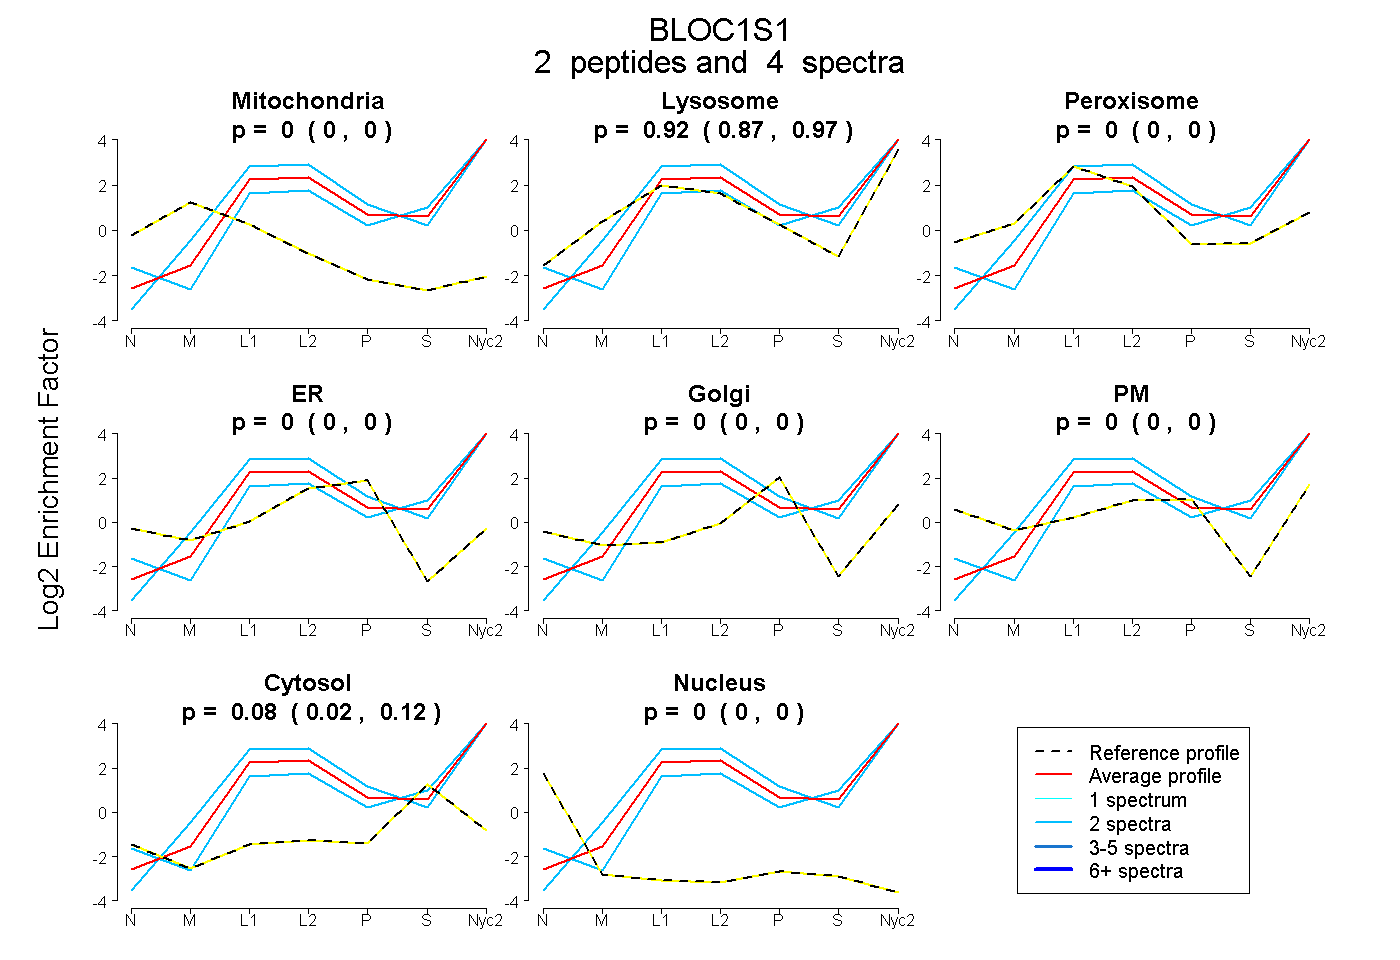
0.000 | 0.000
0.867 | 0.970
0.000 | 0.000
0.000 | 0.000
0.000 | 0.000
0.000 | 0.000
0.022 | 0.124
0.000 | 0.000
3peptides
spectra
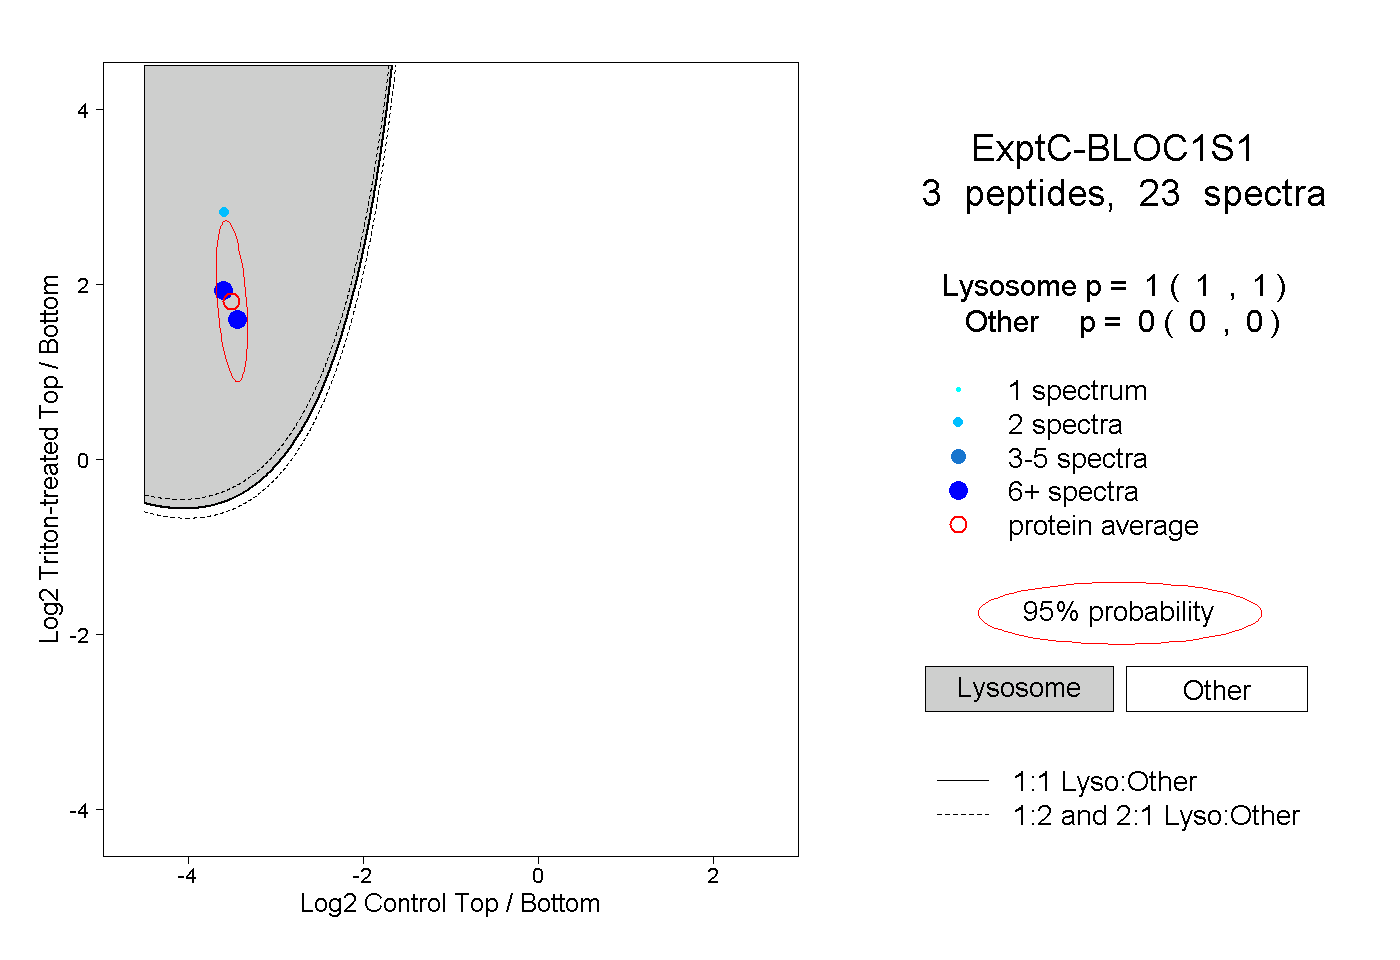
1.000 | 1.000
0.000 | 0.000
2peptides
spectra
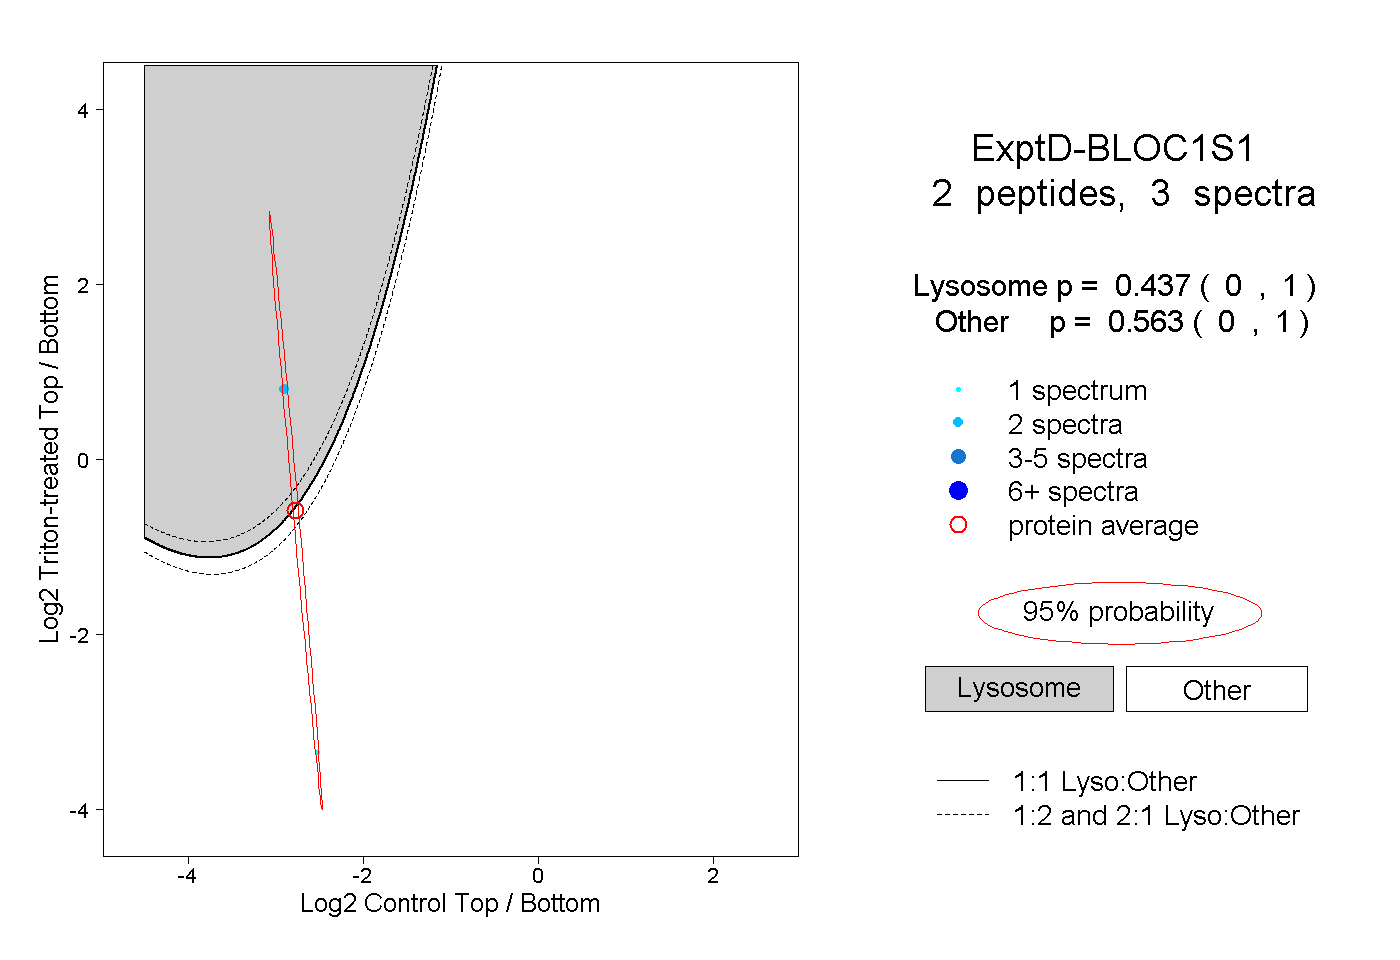
0.000 | 1.000
0.000 | 1.000