 5
5peptides
spectra
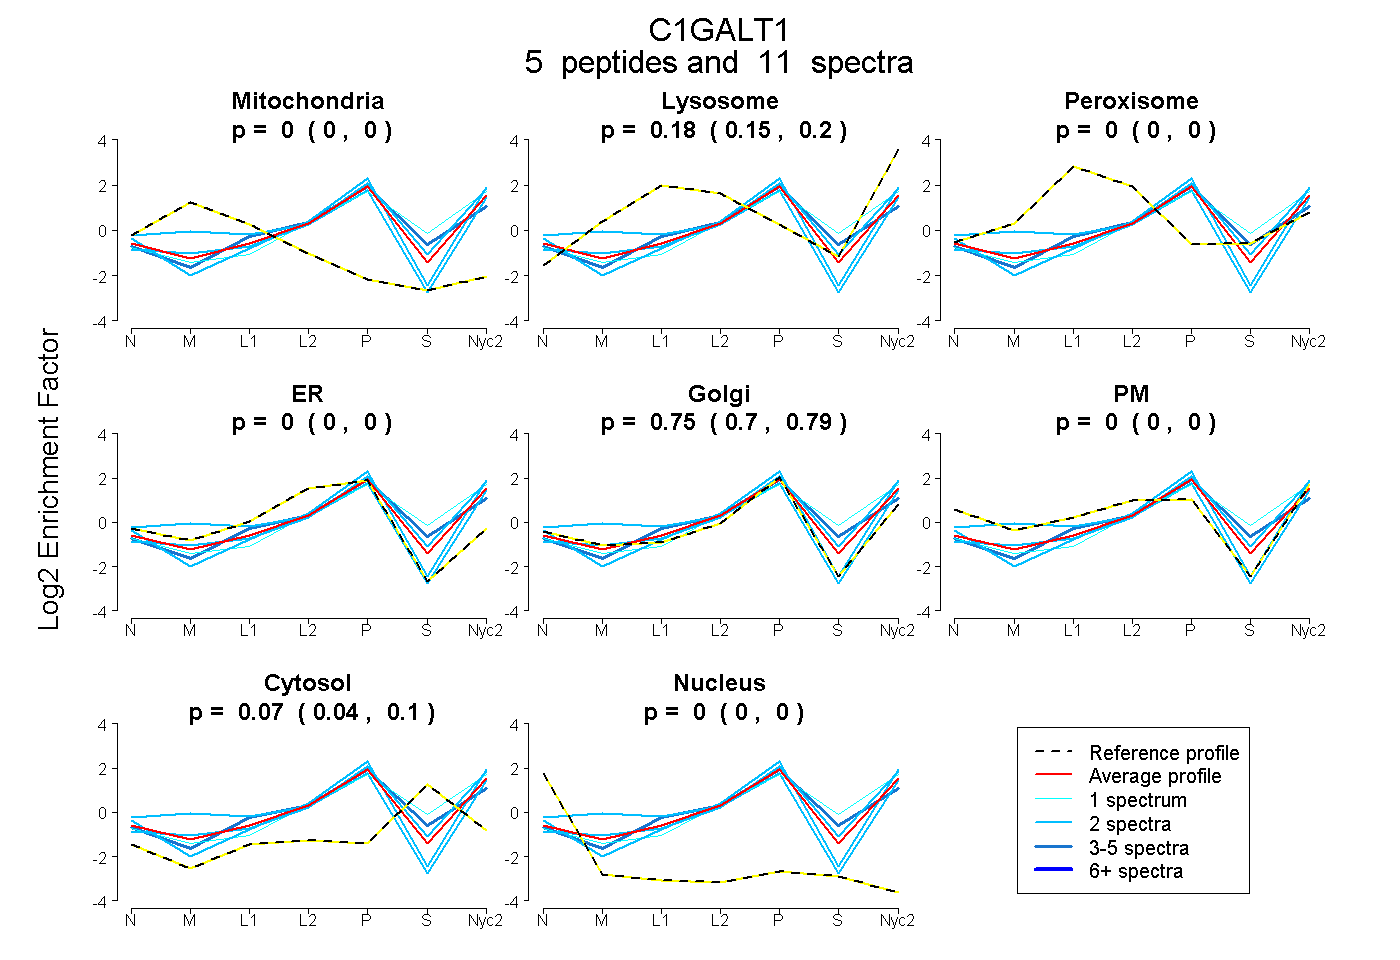
0.000 | 0.000
0.152 | 0.197
0.000 | 0.000
0.000 | 0.000
0.704 | 0.791
0.000 | 0.000
0.037 | 0.101
0.000 | 0.000
2peptides
spectra
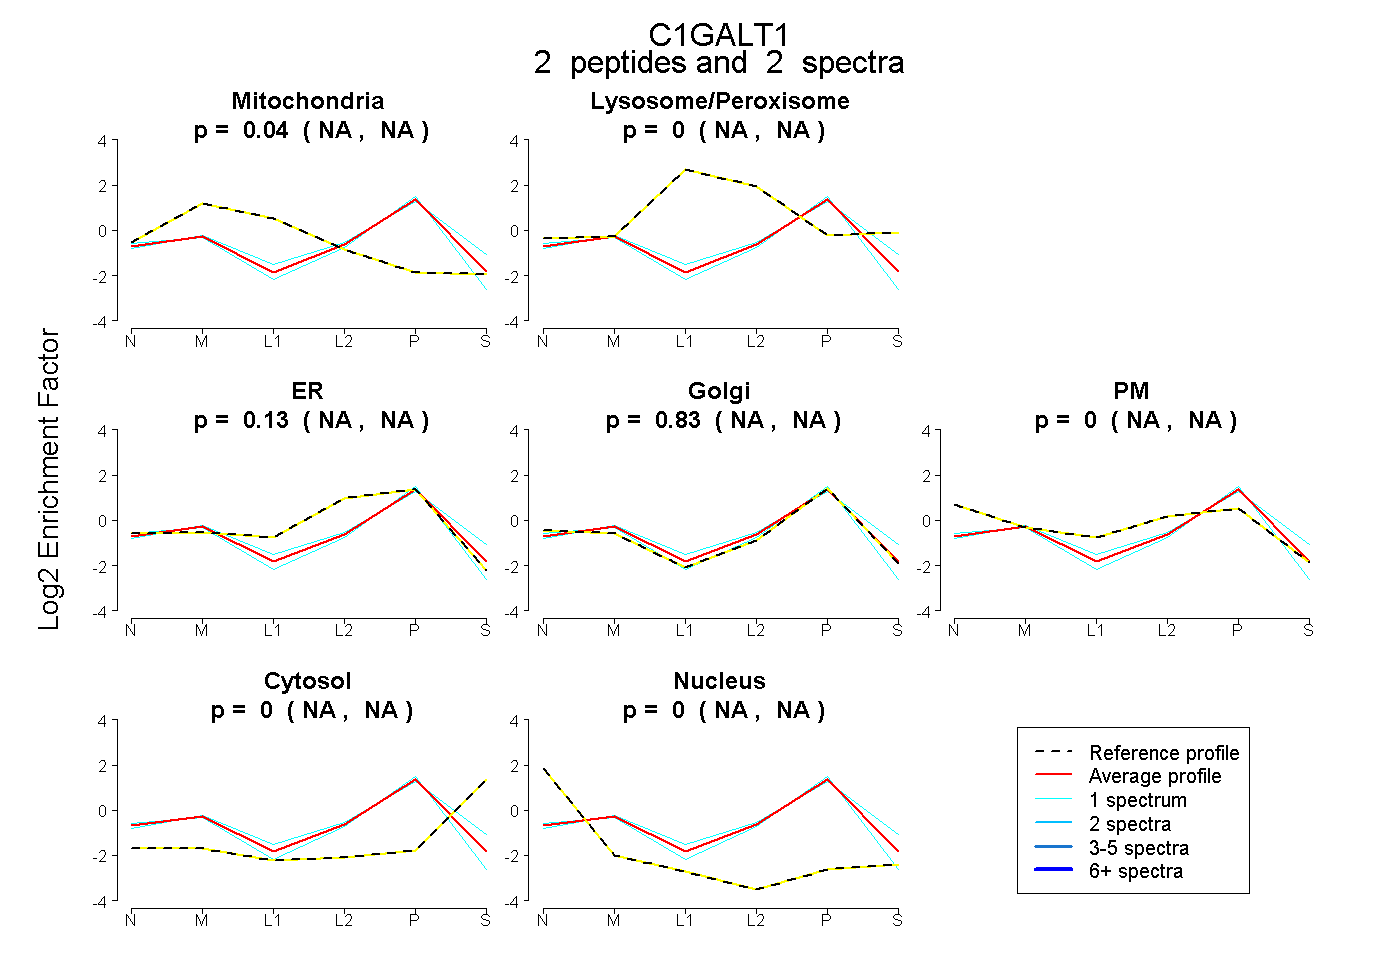
NA | NA
NA | NA
NA | NA
NA | NA
NA | NA
NA | NA
NA | NA
6peptides
spectra
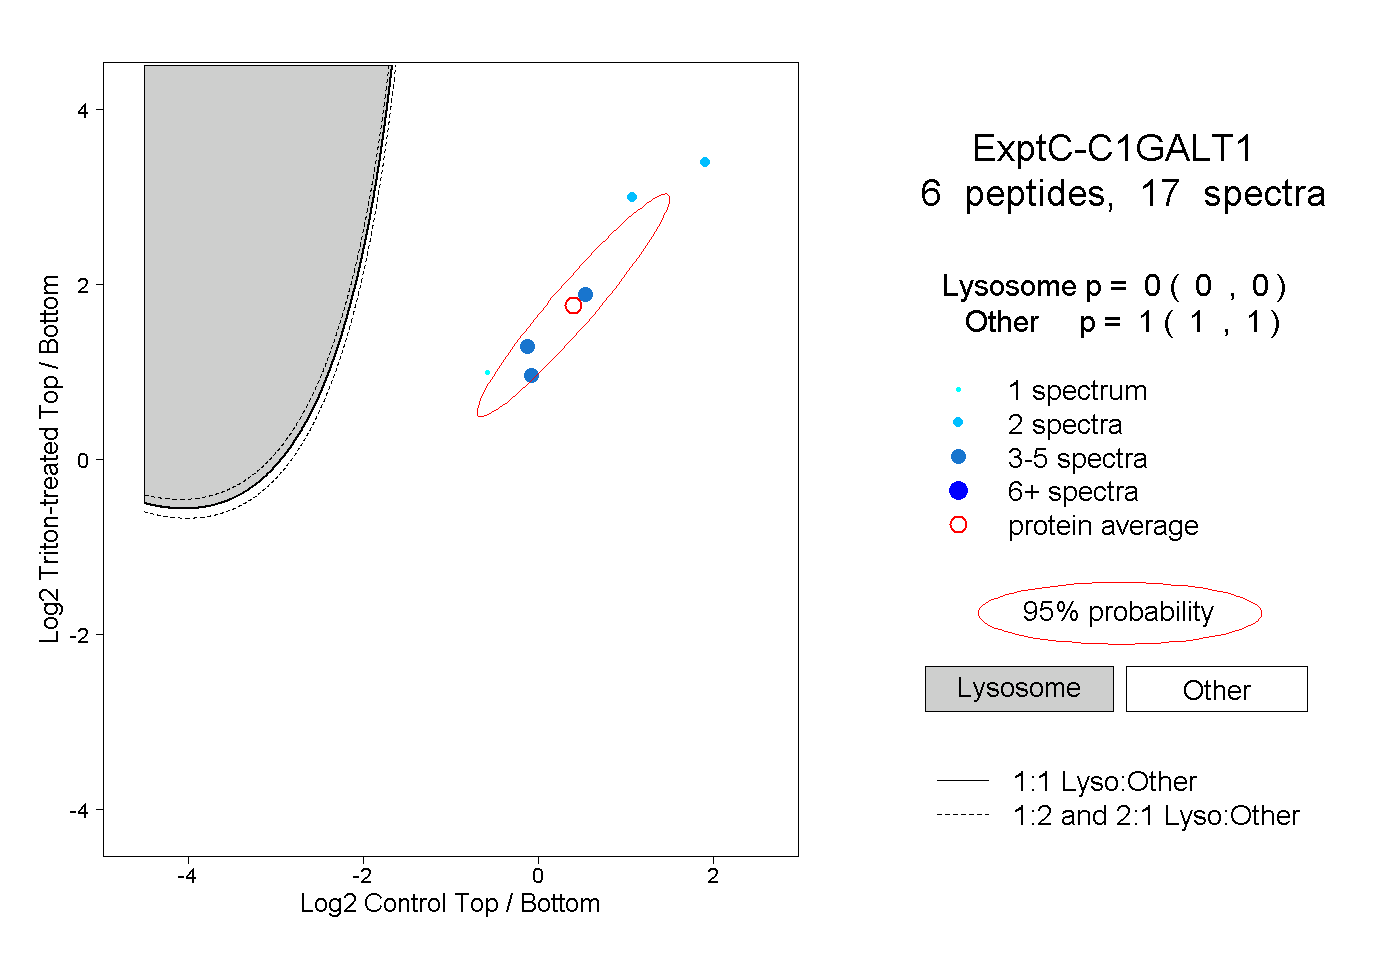
0.000 | 0.000
1.000 | 1.000
1peptide
spectrum
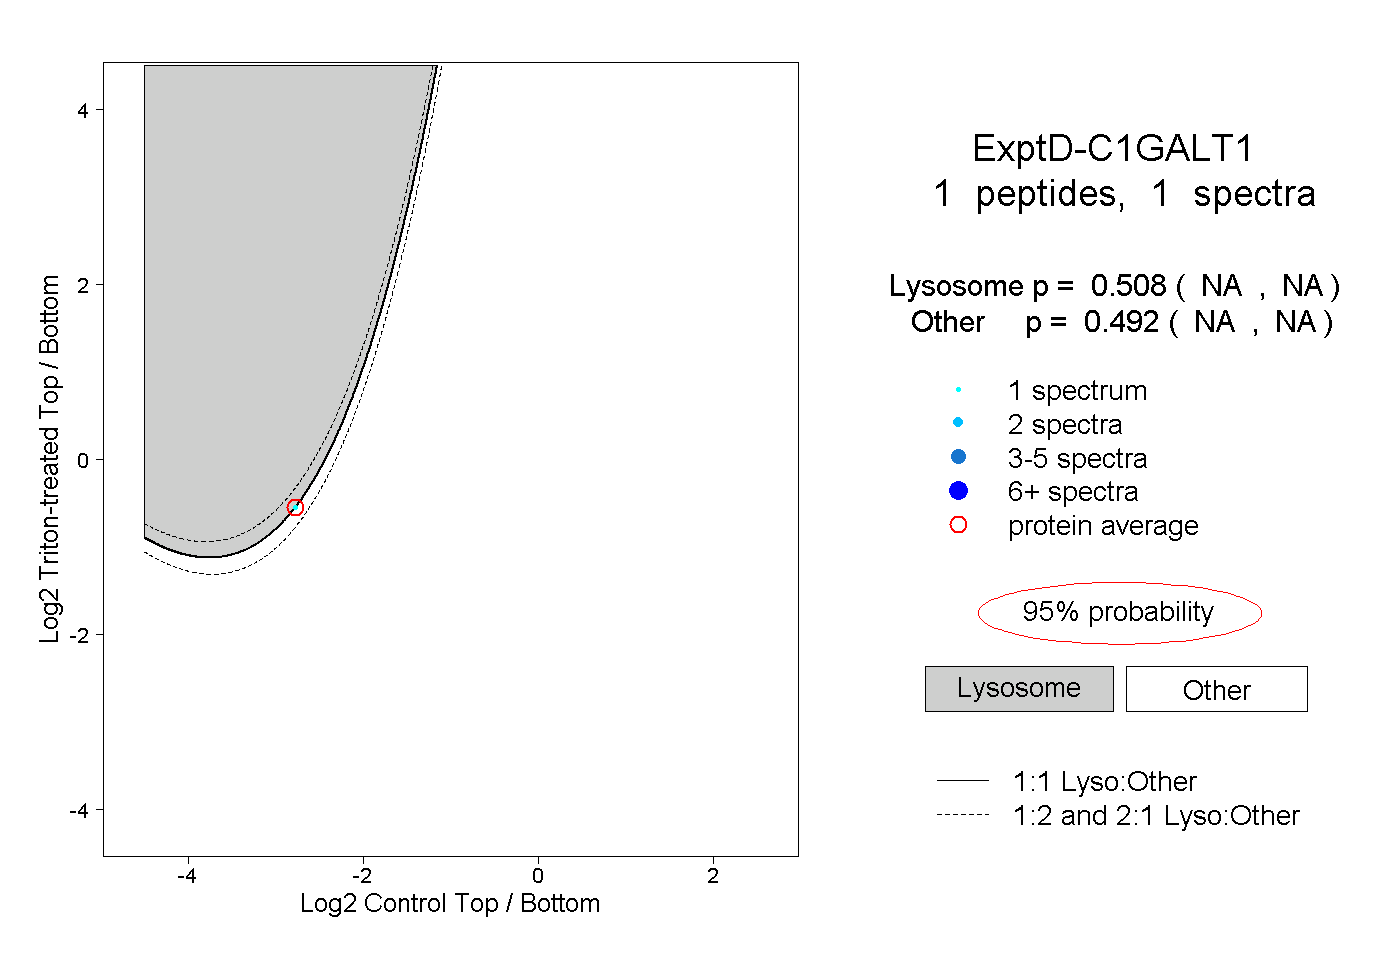
NA | NA
NA | NA