 11
11peptides
spectra
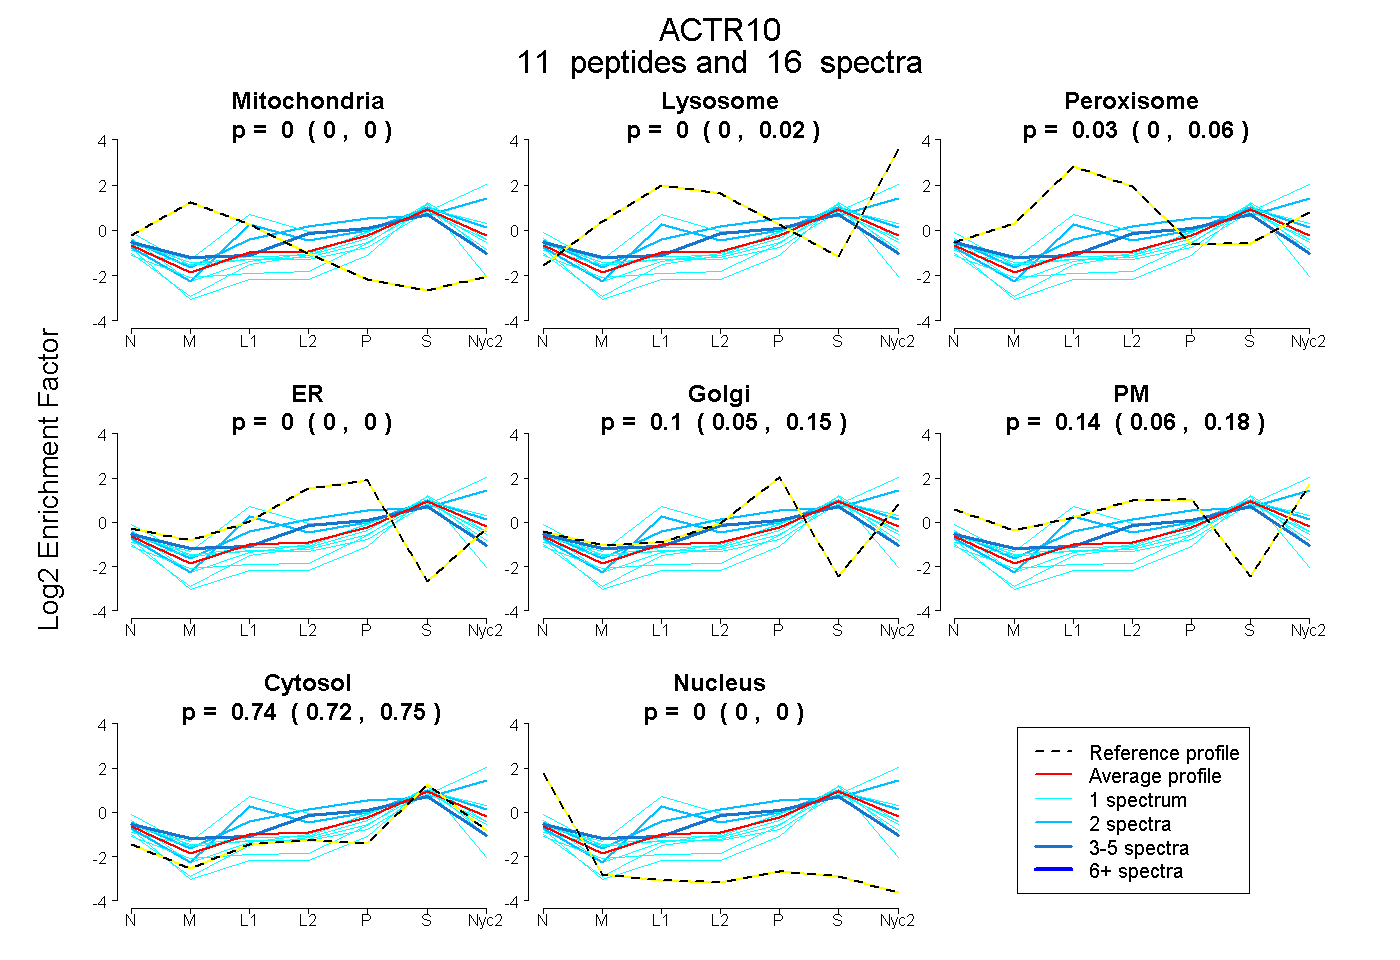
0.000 | 0.000
0.000 | 0.024
0.000 | 0.059
0.000 | 0.000
0.047 | 0.146
0.055 | 0.184
0.719 | 0.752
0.000 | 0.000
1peptide
spectra
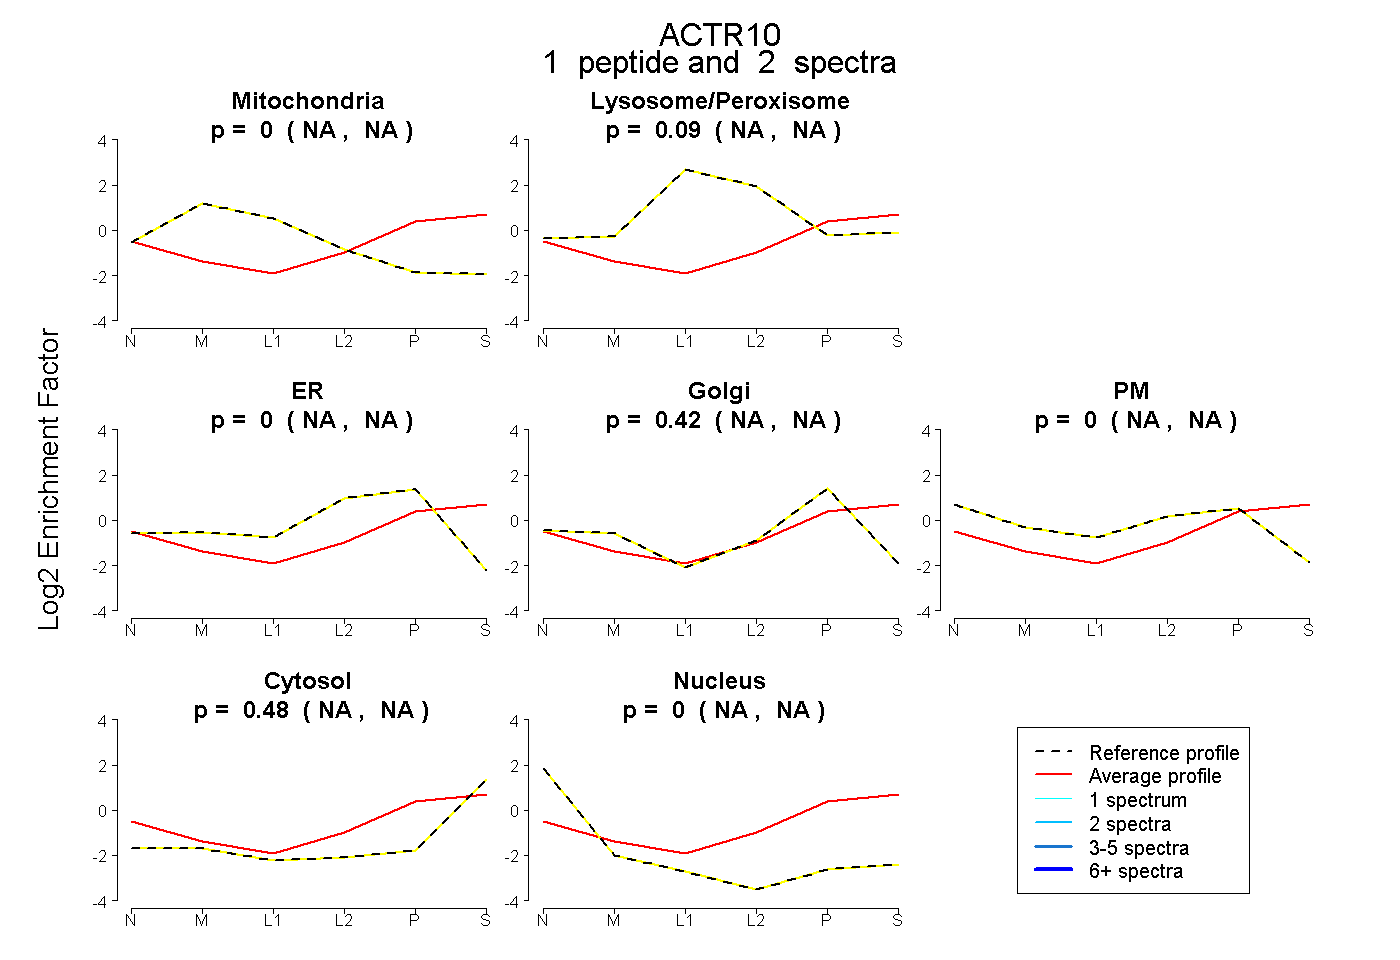
NA | NA
NA | NA
NA | NA
NA | NA
NA | NA
NA | NA
NA | NA
5peptides
spectra
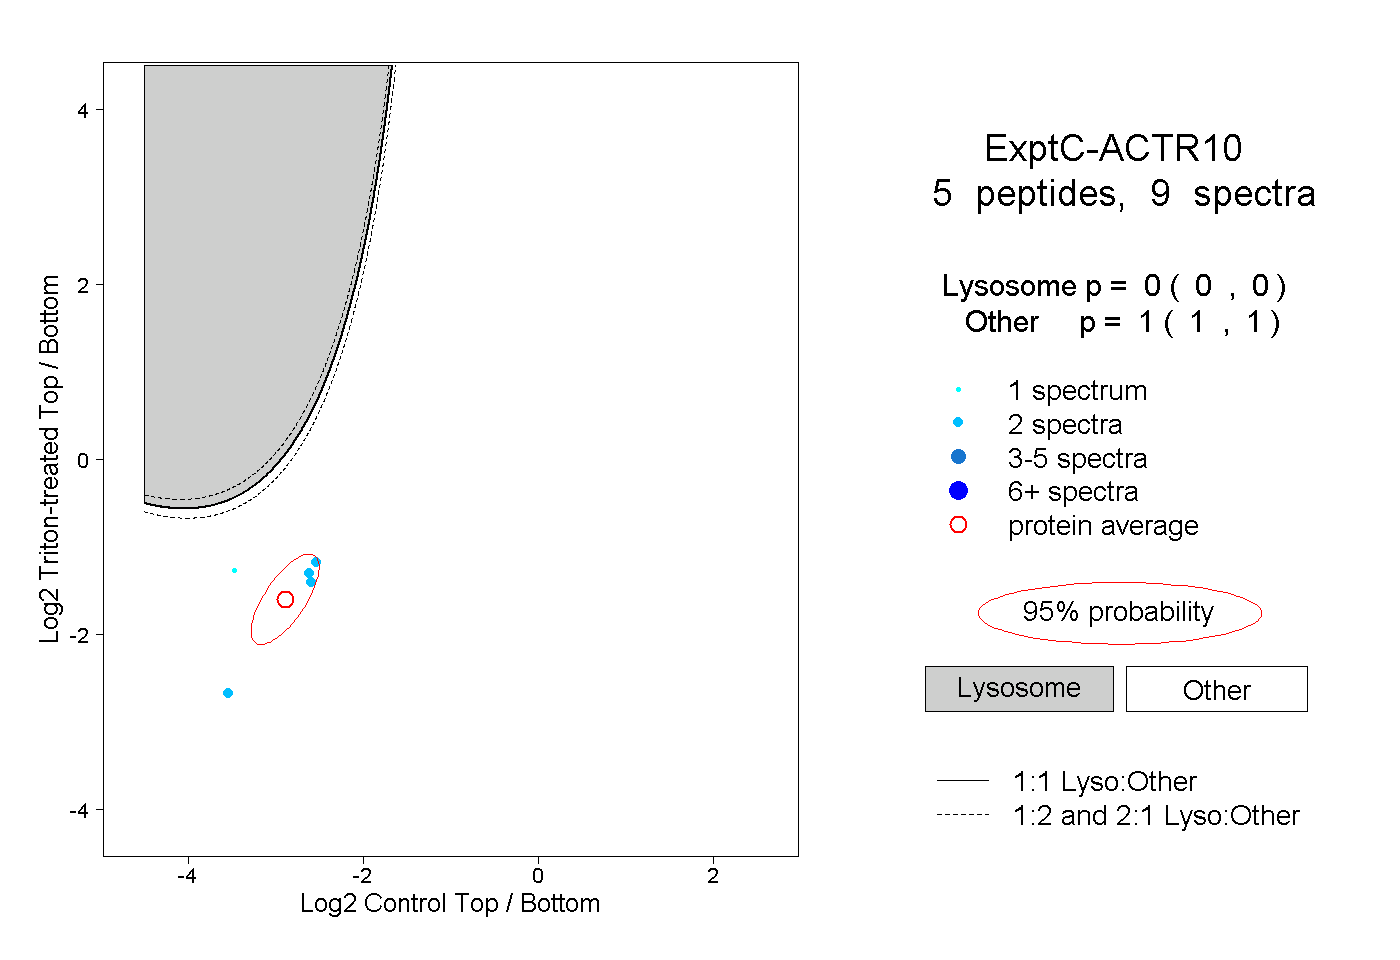
0.000 | 0.000
1.000 | 1.000