 12
12peptides
spectra
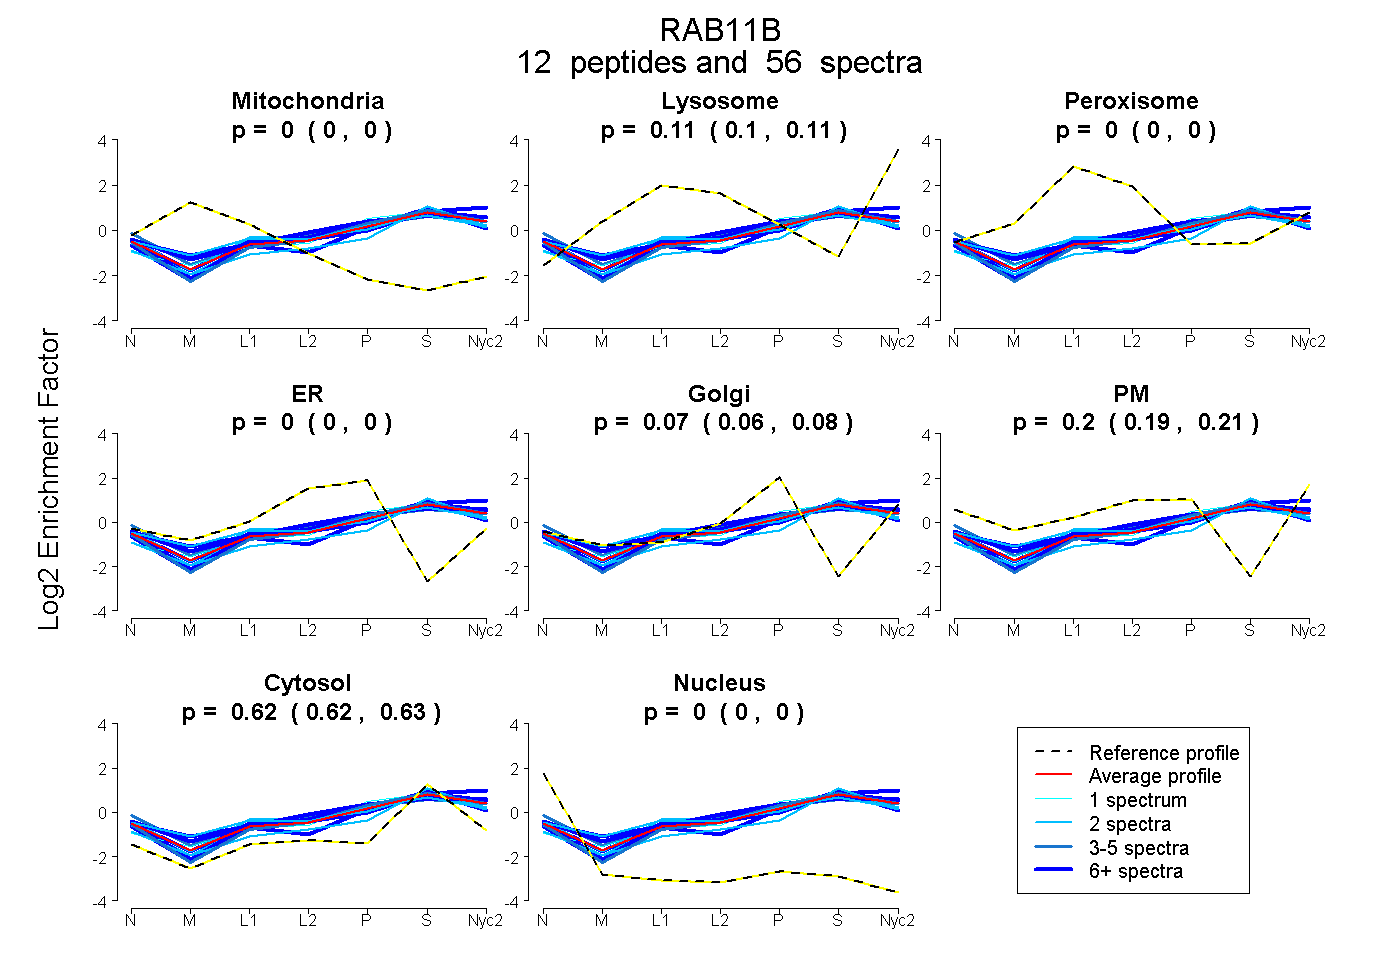
0.000 | 0.000
0.101 | 0.110
0.000 | 0.003
0.000 | 0.000
0.063 | 0.078
0.188 | 0.207
0.621 | 0.626
0.000 | 0.000
7peptides
spectra
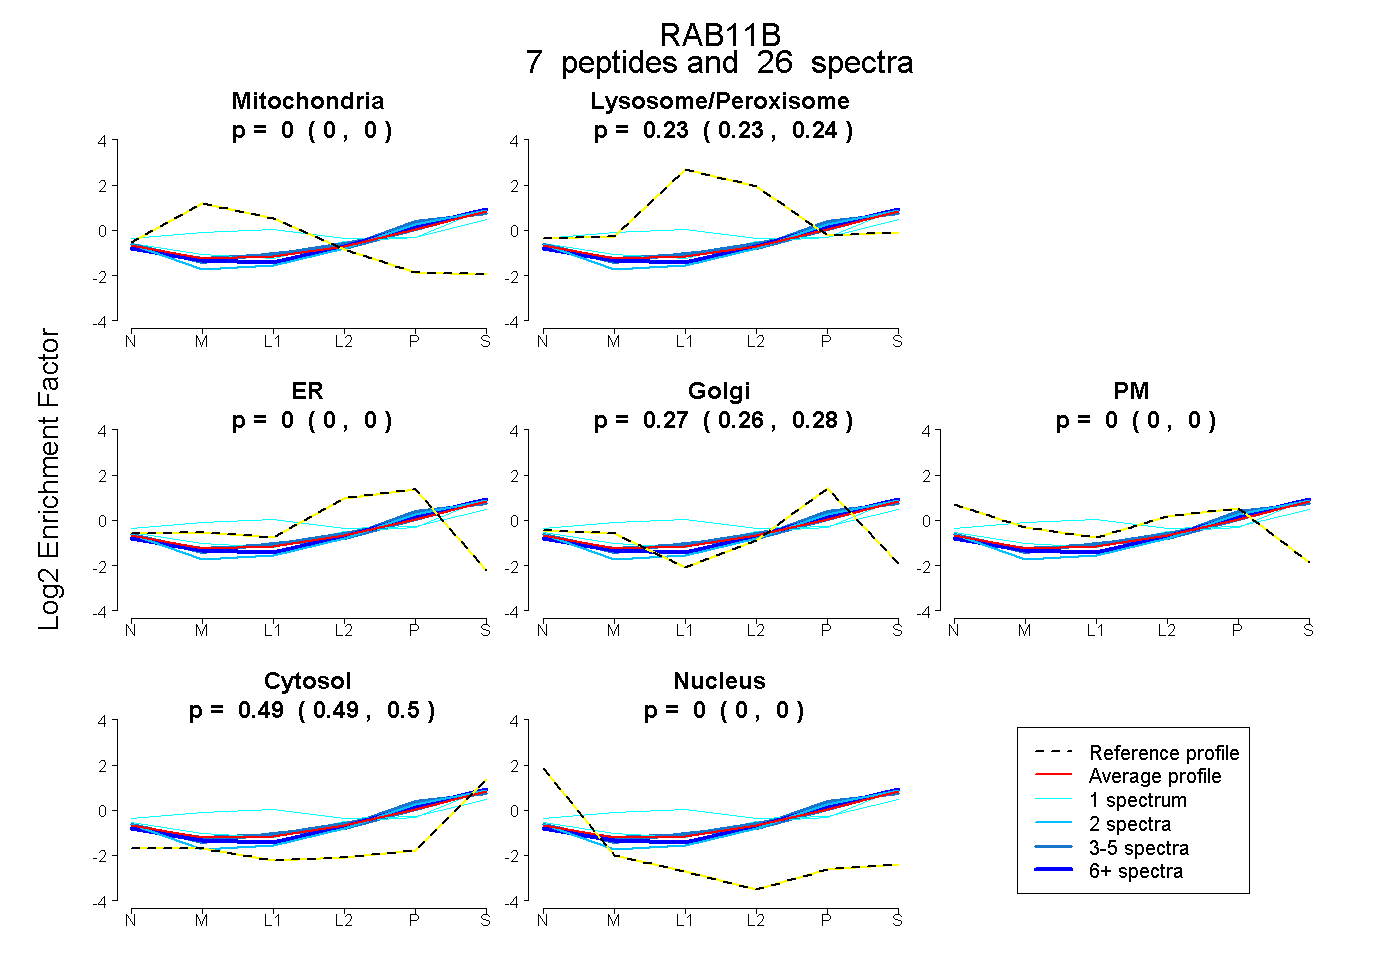
0.000 | 0.000
0.228 | 0.240
0.000 | 0.000
0.265 | 0.279
0.000 | 0.000
0.487 | 0.498
0.000 | 0.000
12peptides
spectra
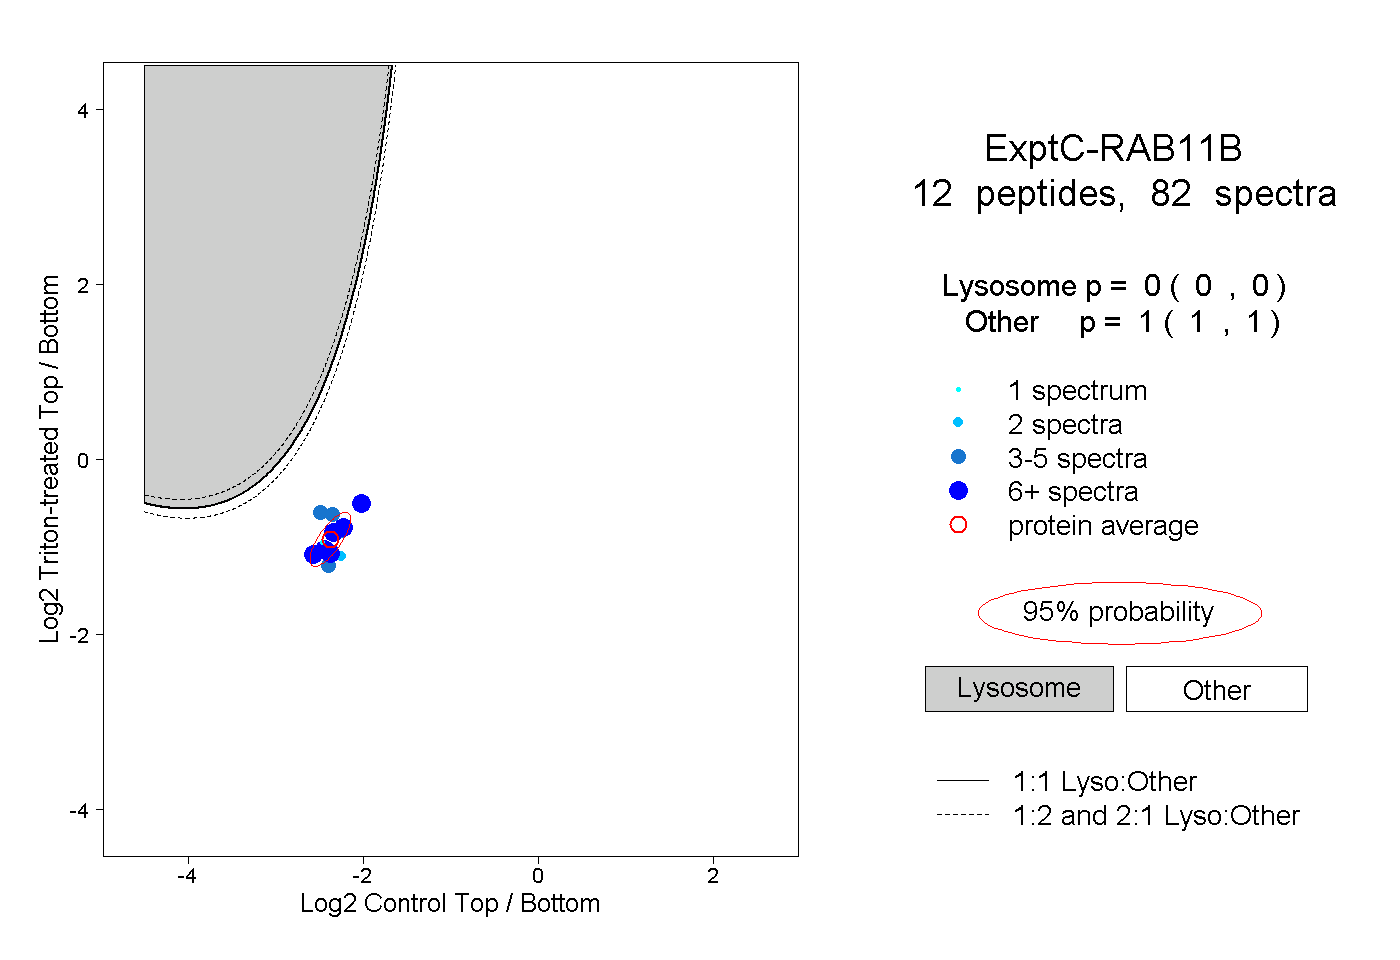
0.000 | 0.000
1.000 | 1.000
4peptides
spectra
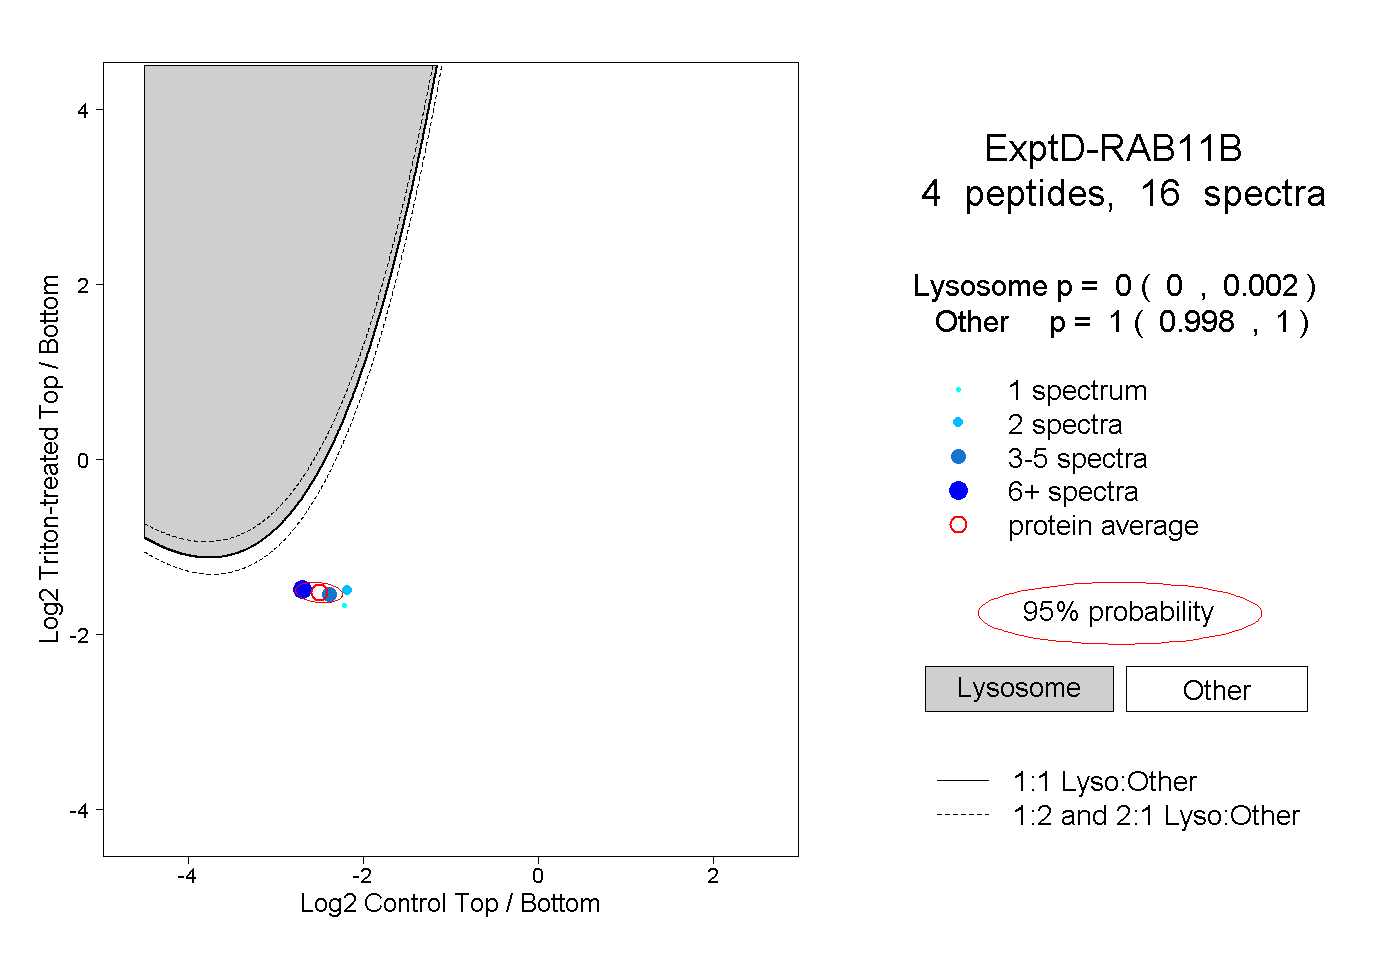
0.000 | 0.002
0.998 | 1.000