 4
4peptides
spectra
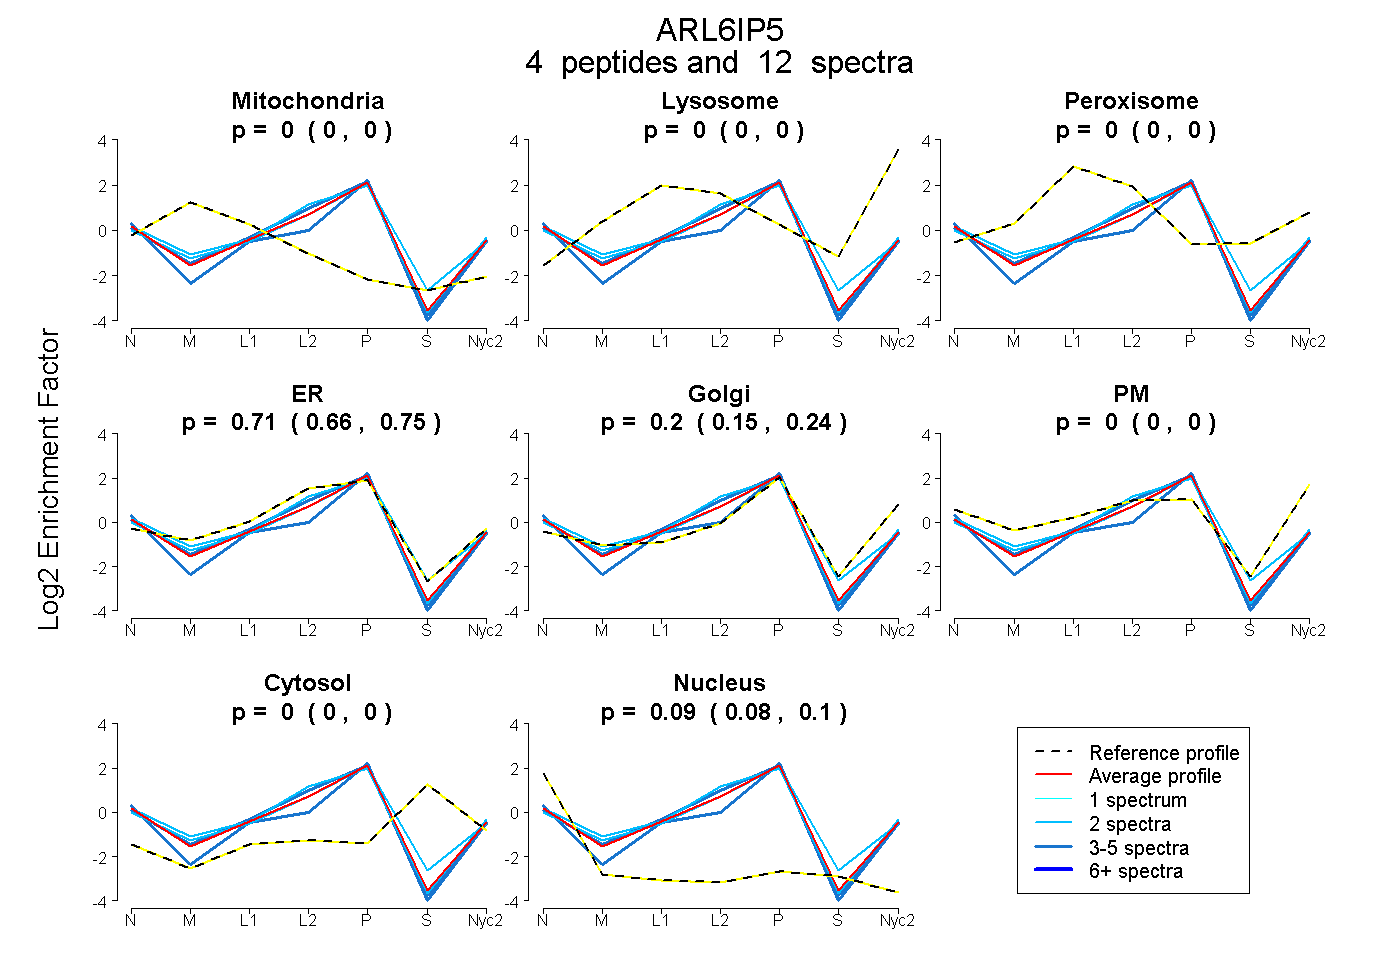
0.000 | 0.000
0.000 | 0.000
0.000 | 0.000
0.658 | 0.752
0.152 | 0.243
0.000 | 0.000
0.000 | 0.000
0.080 | 0.096
3peptides
spectra
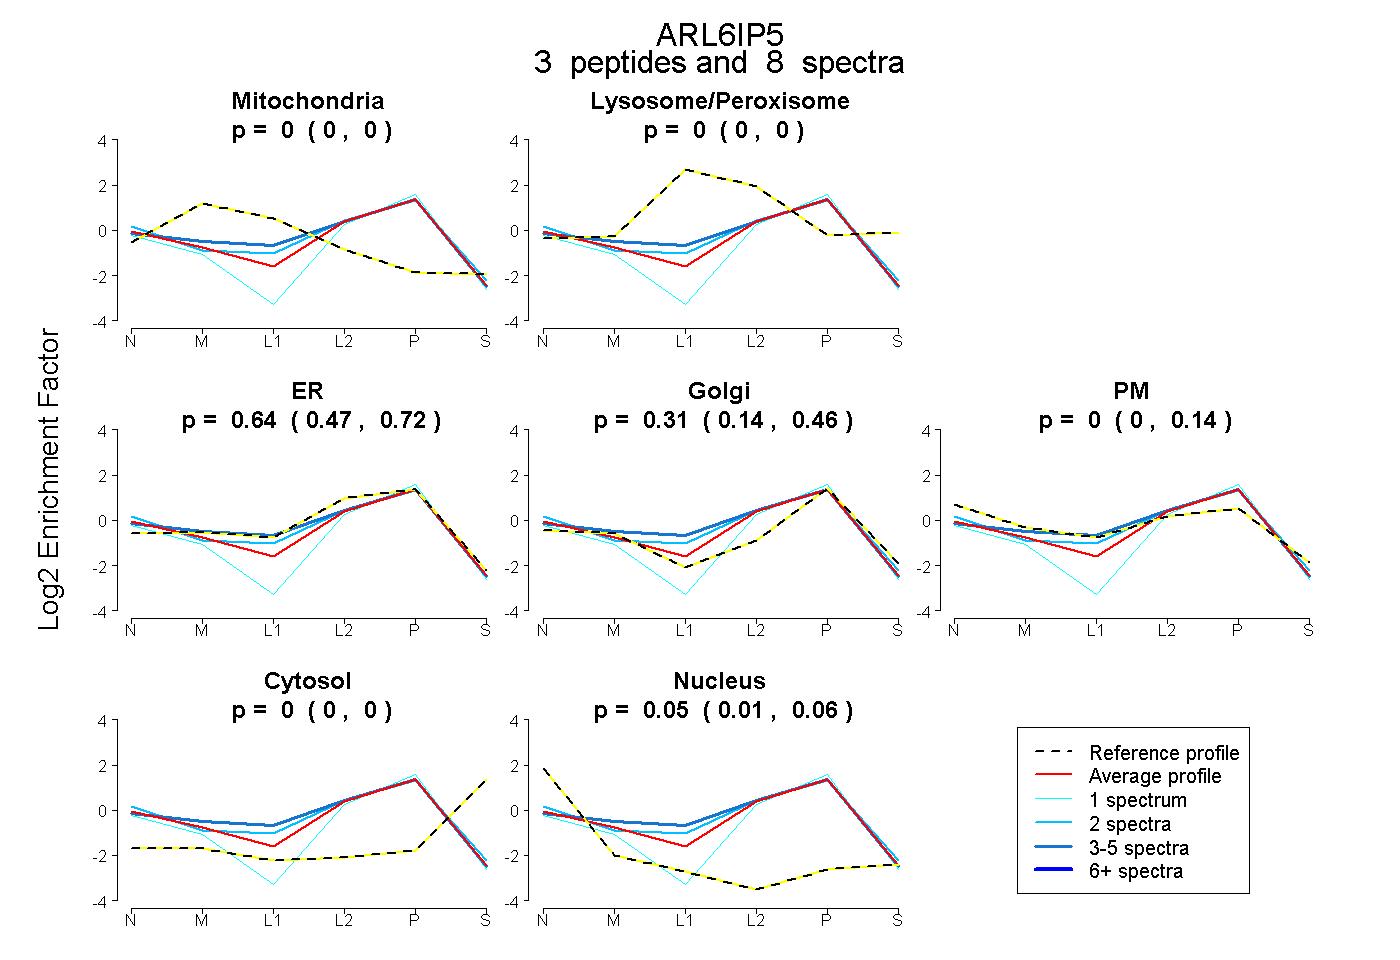
0.000 | 0.000
0.000 | 0.000
0.473 | 0.720
0.145 | 0.455
0.000 | 0.137
0.000 | 0.000
0.008 | 0.063
3peptides
spectra
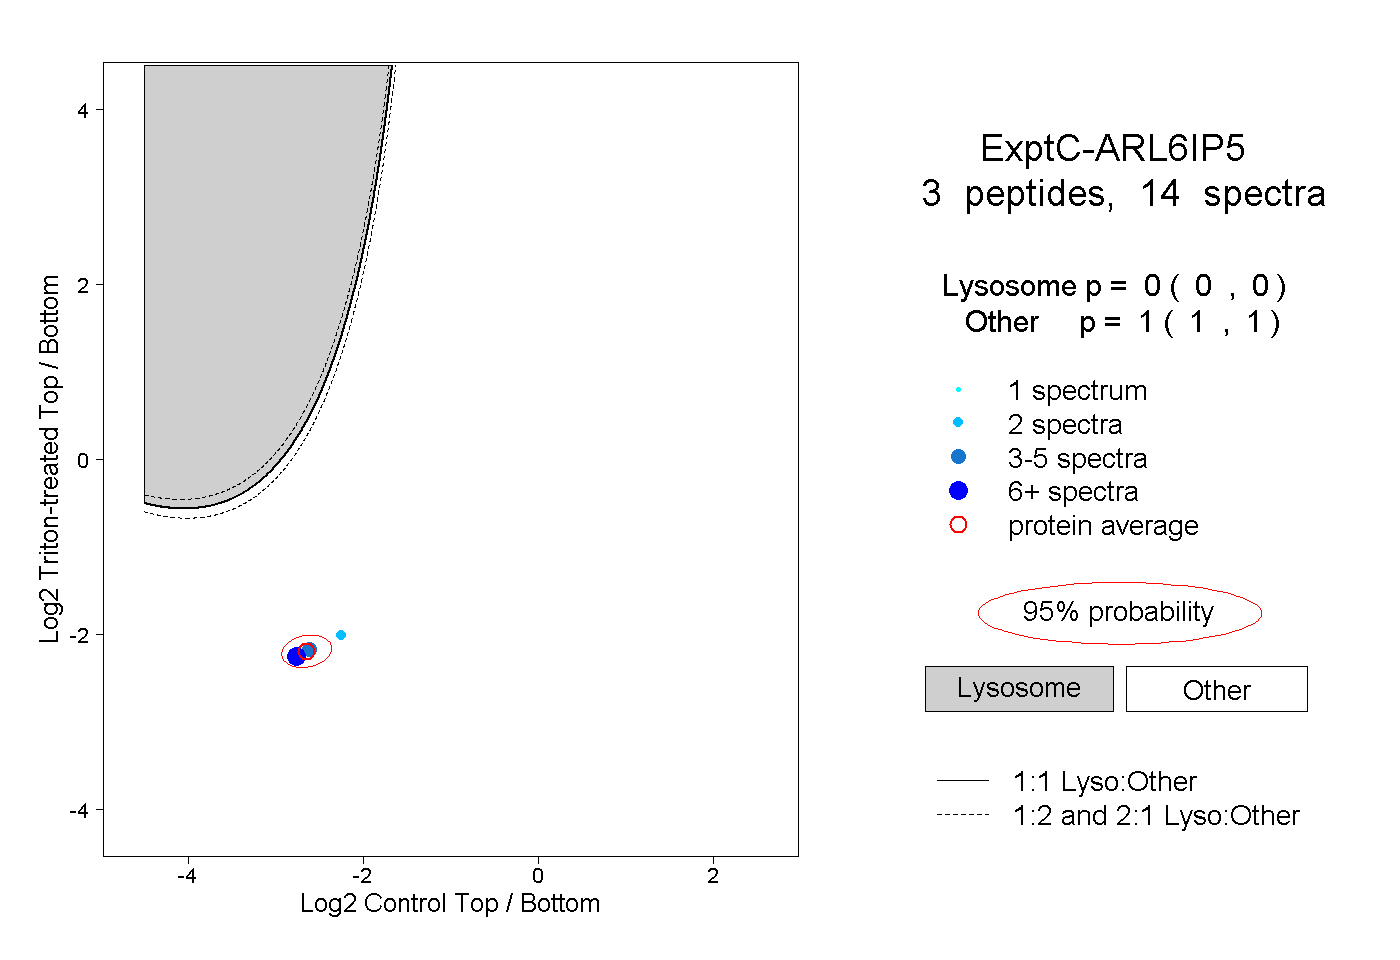
0.000 | 0.000
1.000 | 1.000
1peptide
spectra
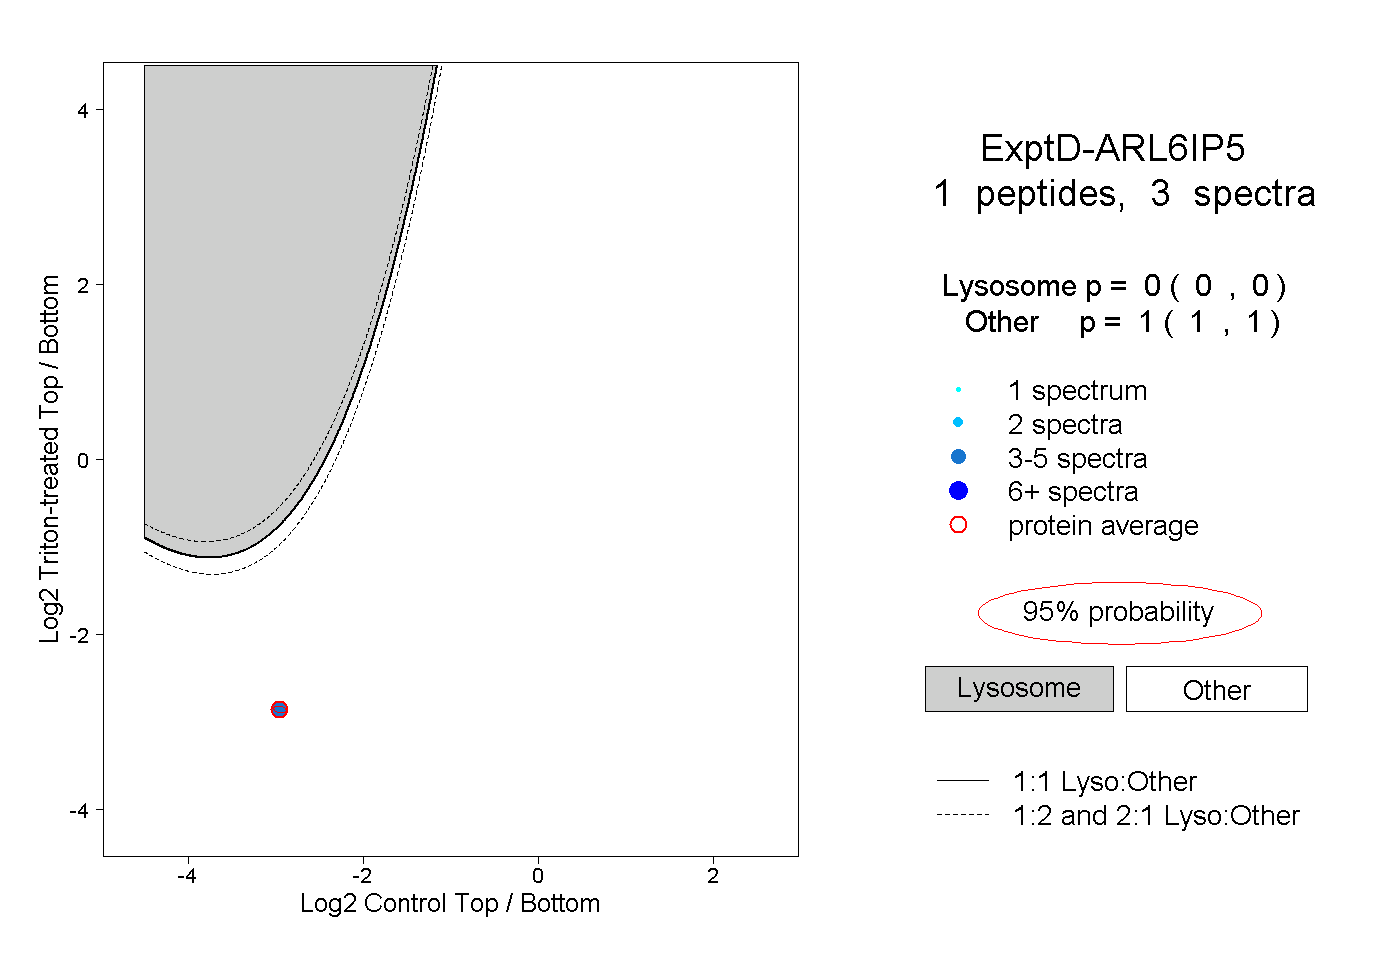
0.000 | 0.000
1.000 | 1.000