 17
17peptides
spectra
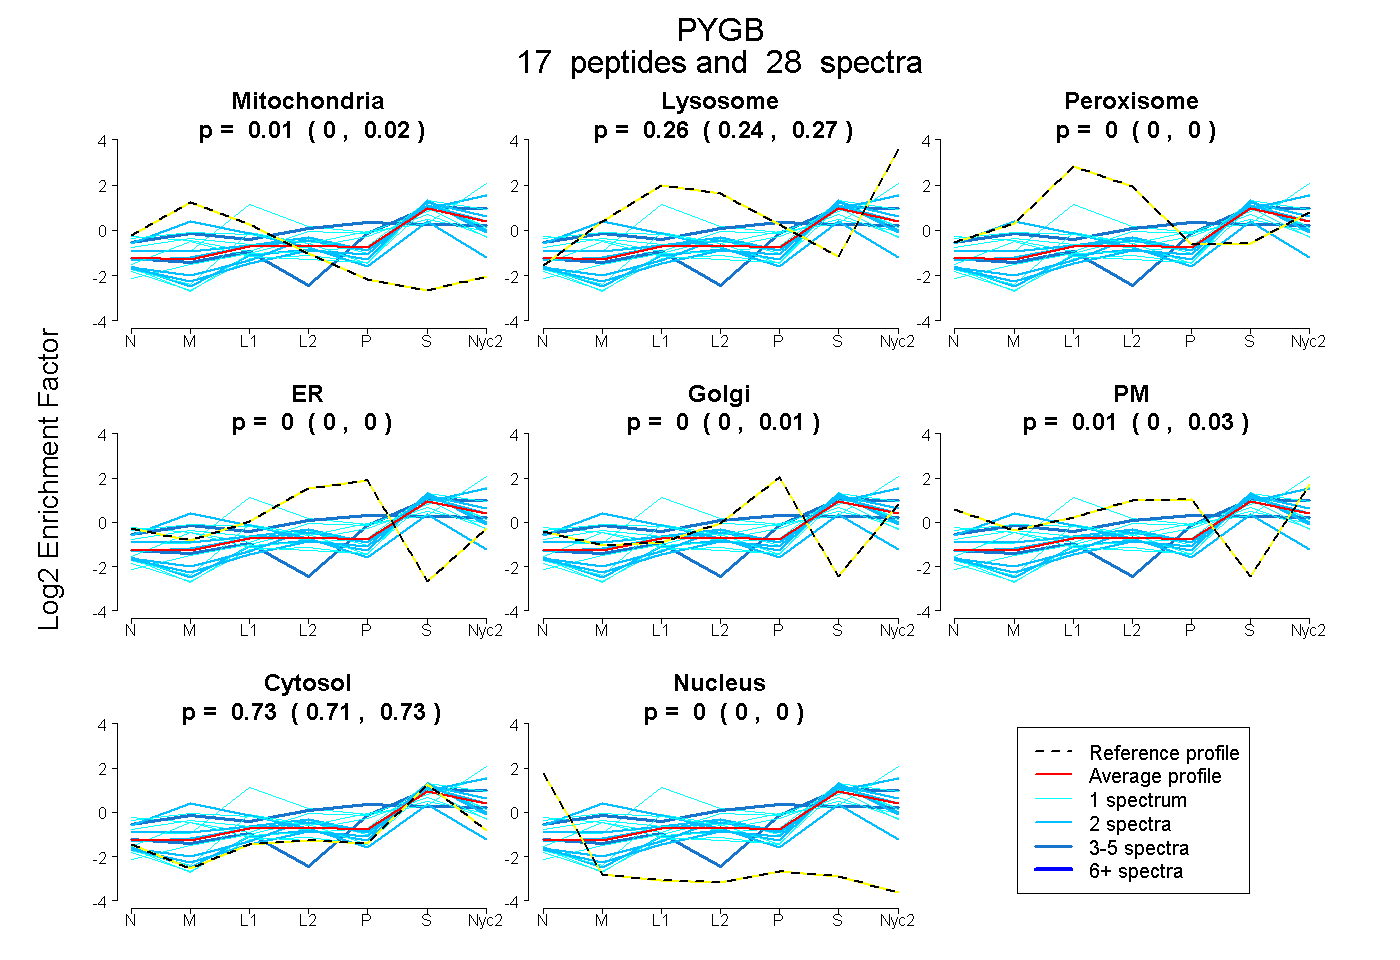
0.000 | 0.017
0.240 | 0.268
0.000 | 0.000
0.000 | 0.000
0.000 | 0.008
0.000 | 0.027
0.714 | 0.734
0.000 | 0.000
3peptides
spectra
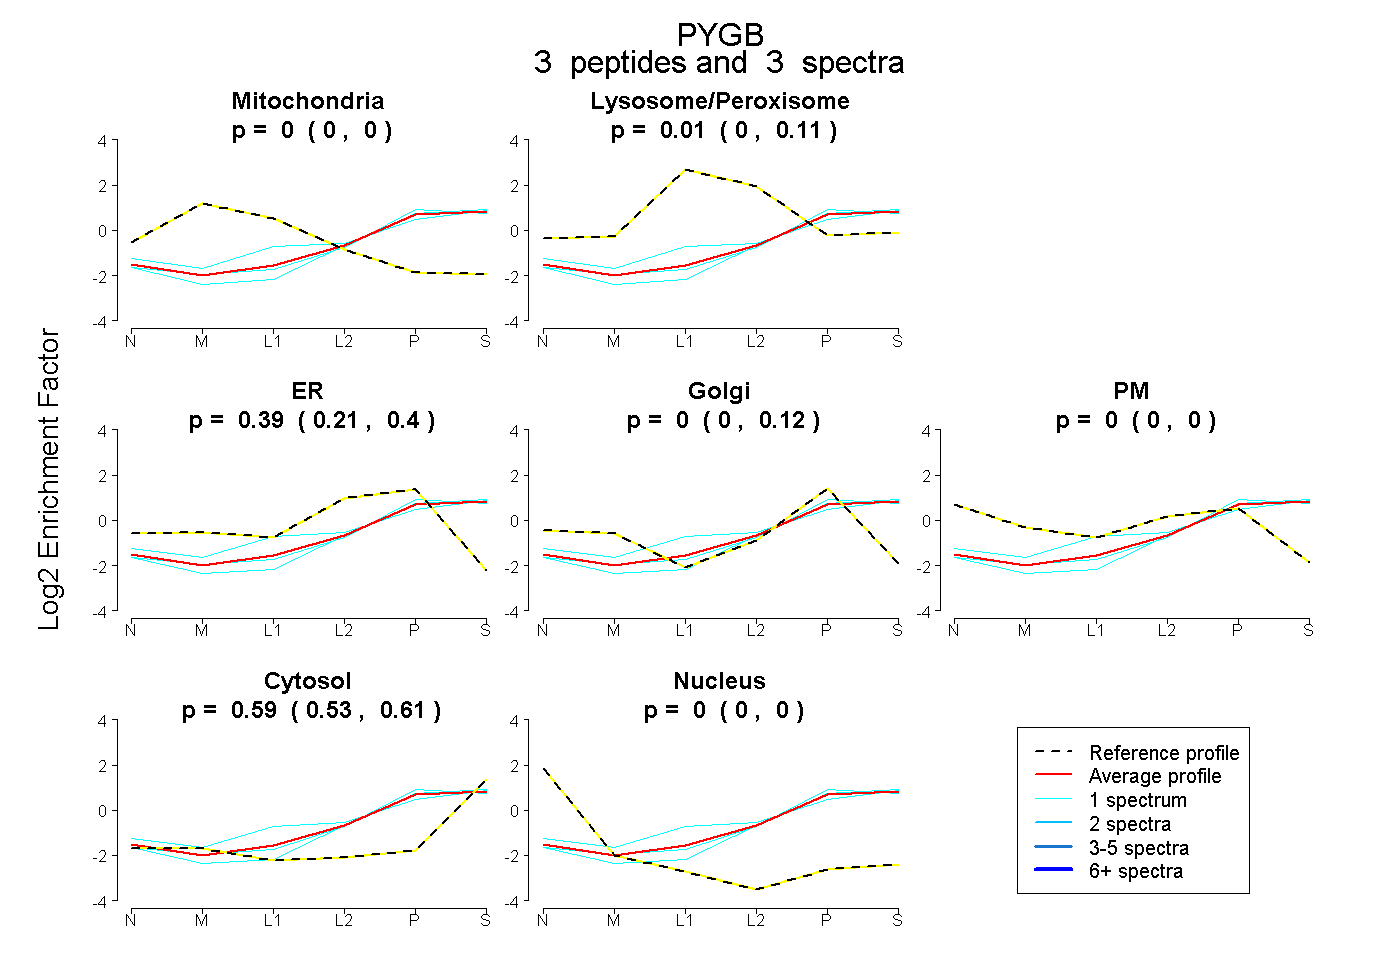
0.000 | 0.000
0.000 | 0.114
0.214 | 0.402
0.000 | 0.118
0.000 | 0.000
0.532 | 0.612
0.000 | 0.000
9peptides
spectra
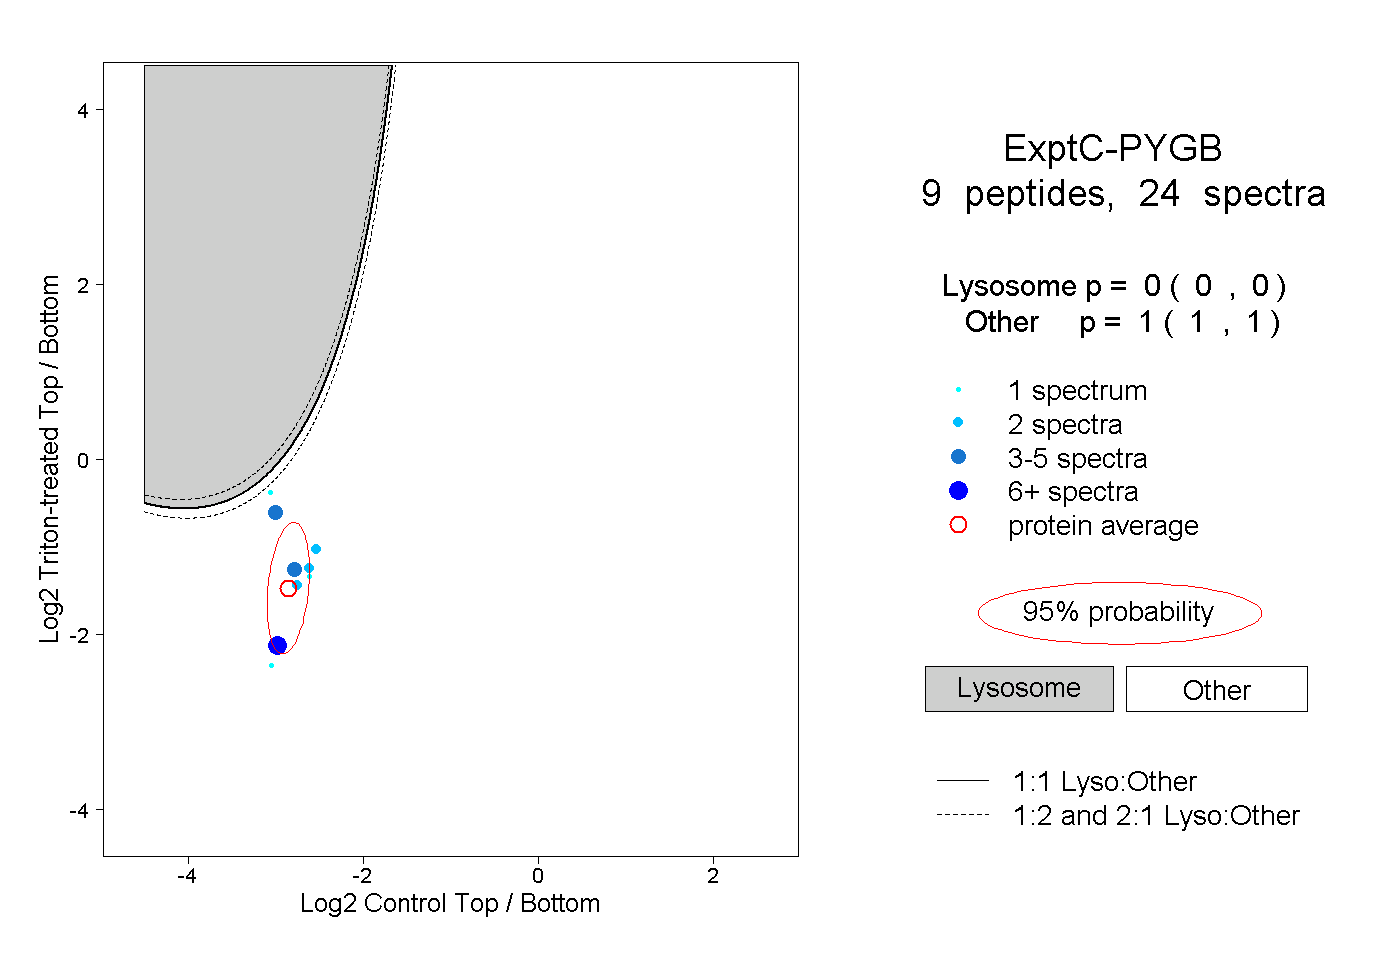
0.000 | 0.000
1.000 | 1.000