PYGB
[ENSRNOP00000010158]
Main page
| | | Plot |
Mito |
Lyso |
|
Perox |
ER |
Golgi |
PM |
Cytosol |
Nucleus |
|
| Expt A |
 17
17
peptides |
28
spectra |
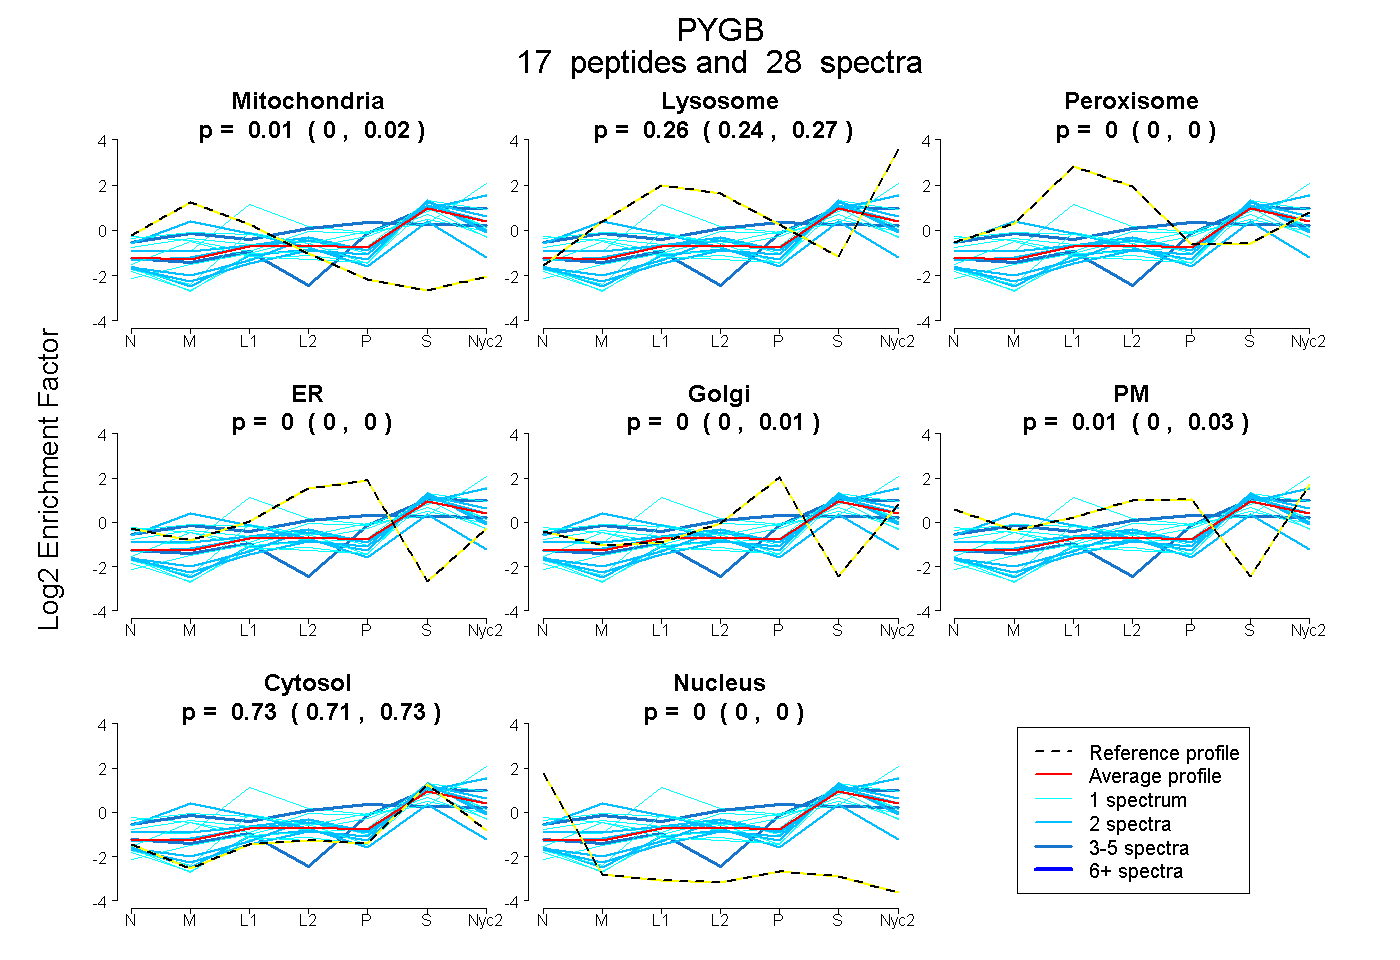 |
0.006
0.000 | 0.017 |
0.256
0.240 | 0.268 |
|
0.000
0.000 | 0.000 |
0.000
0.000 | 0.000 |
0.000
0.000 | 0.008 |
0.013
0.000 | 0.027 |
0.726
0.714 | 0.734 |
0.000
0.000 | 0.000 |
|
| | | Plot |
Mito |
|
Lyso or Perox |
|
ER |
Golgi |
PM |
Cytosol |
Nucleus |
|
| Expt B |
3
peptides |
3
spectra |
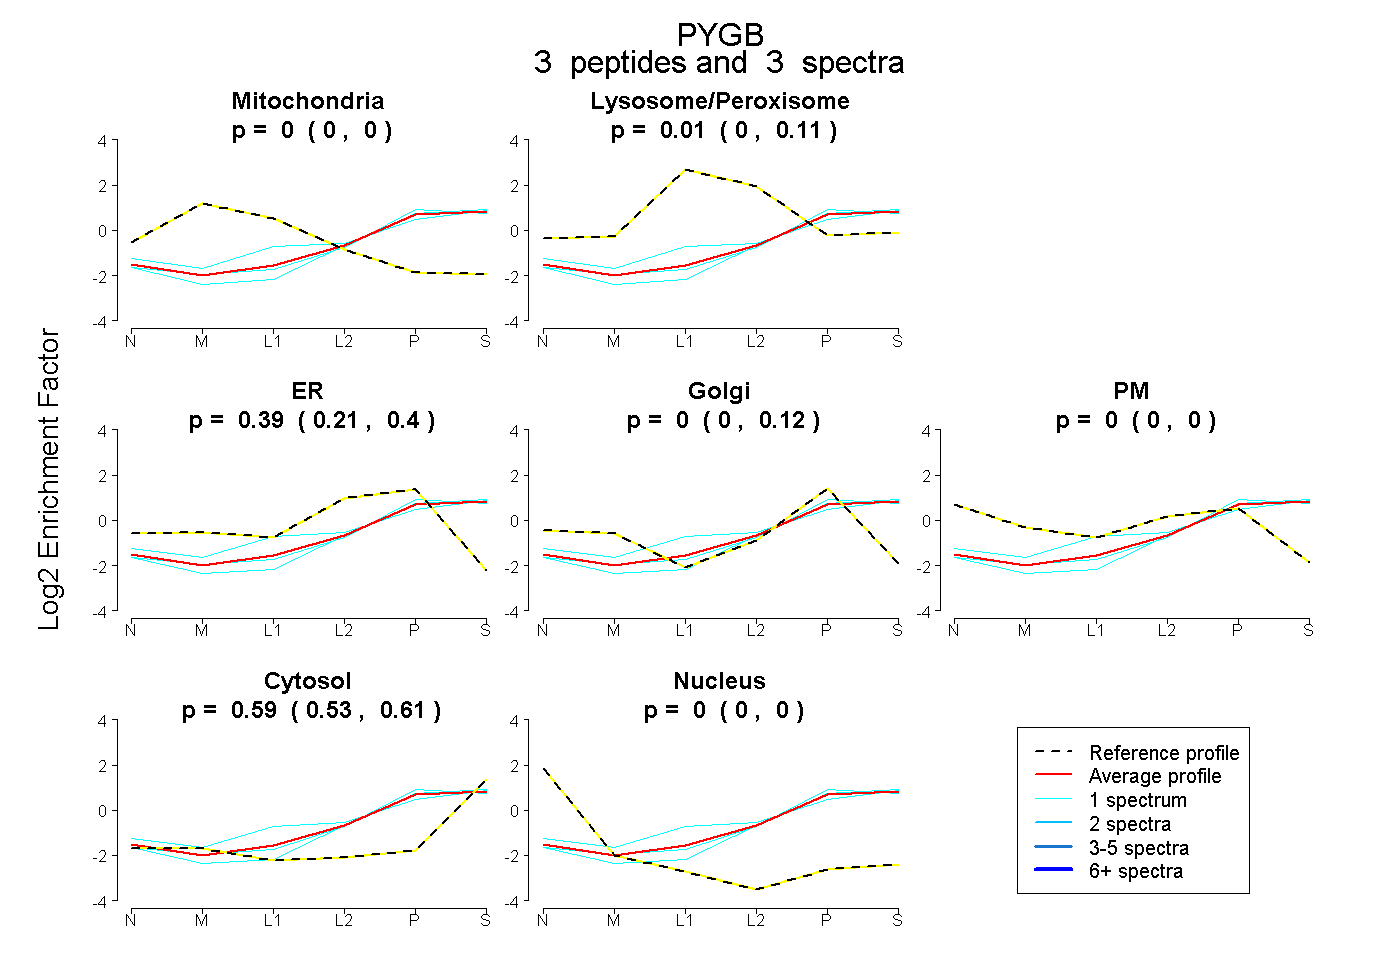 |
0.000
0.000 | 0.000 |
|
0.013
0.000 | 0.114 |
|
0.393
0.214 | 0.402 |
0.000
0.000 | 0.118 |
0.000
0.000 | 0.000 |
0.594
0.532 | 0.612 |
0.000
0.000 | 0.000 |
|
| 1 spectrum, LLSLVDDEAFIR |
0.000 |
|
0.000 |
|
0.276 |
0.106 |
0.000 |
0.618 |
0.000 |
|
| 1 spectrum, VEDVEALDQK |
0.000 |
|
0.000 |
|
0.341 |
0.096 |
0.000 |
0.563 |
0.000 |
|
| 1 spectrum, DFYELEPEK |
0.000 |
|
0.285 |
|
0.000 |
0.243 |
0.000 |
0.472 |
0.000 |
|
| | | Plot |
|
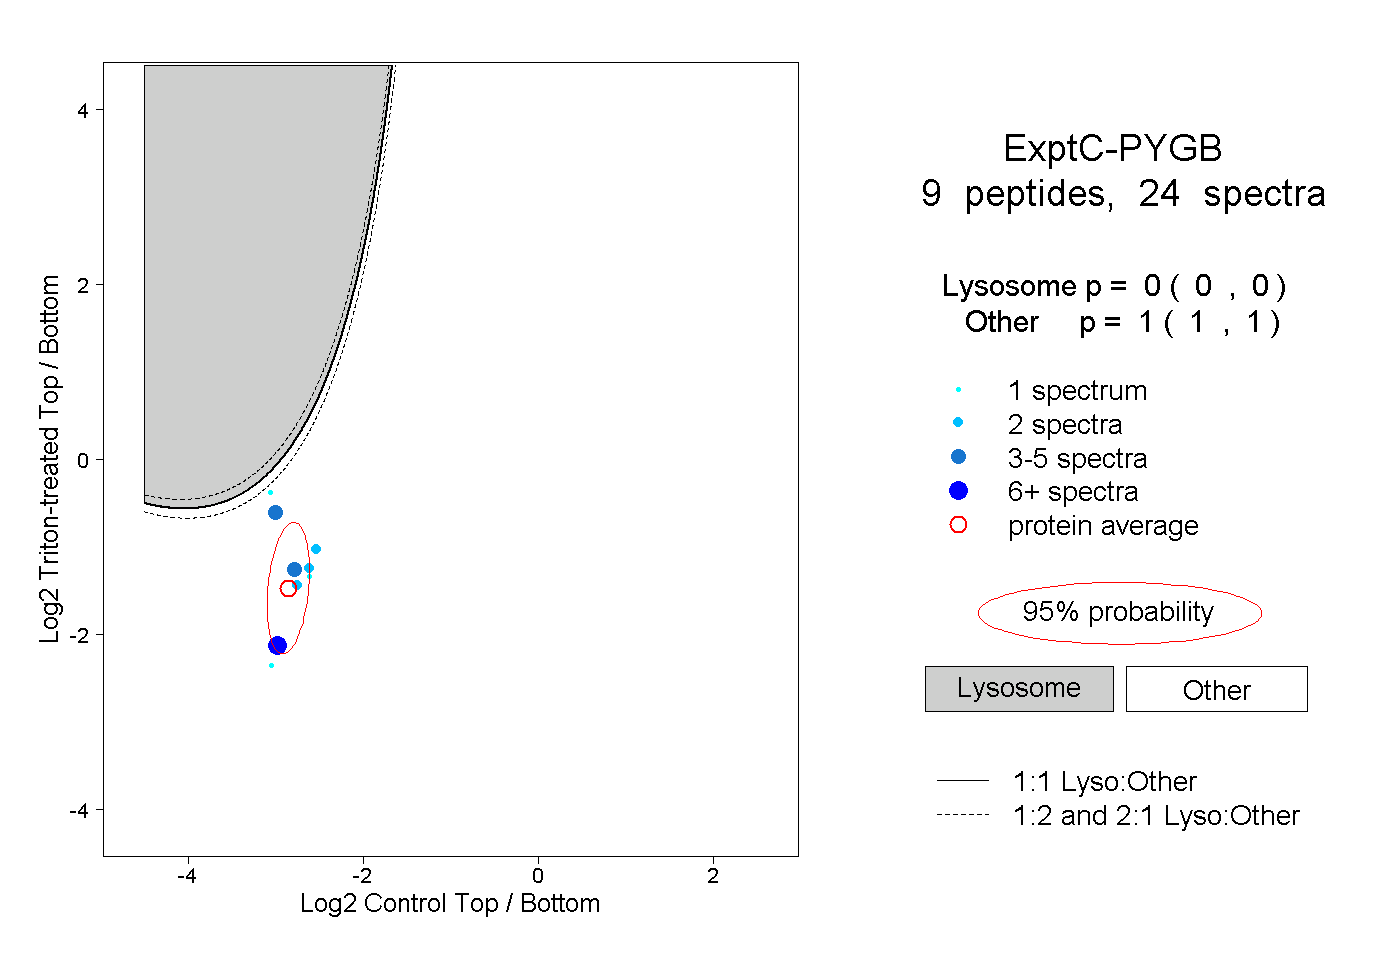
Lyso |
|
|
|
|
|
|
|
Other |
| Expt C |
9
peptides |
24
spectra |
 |
|
0.000
0.000 | 0.000 |
|
|
|
|
|
|
|
1.000
1.000 | 1.000 |