 5
5peptides
spectra
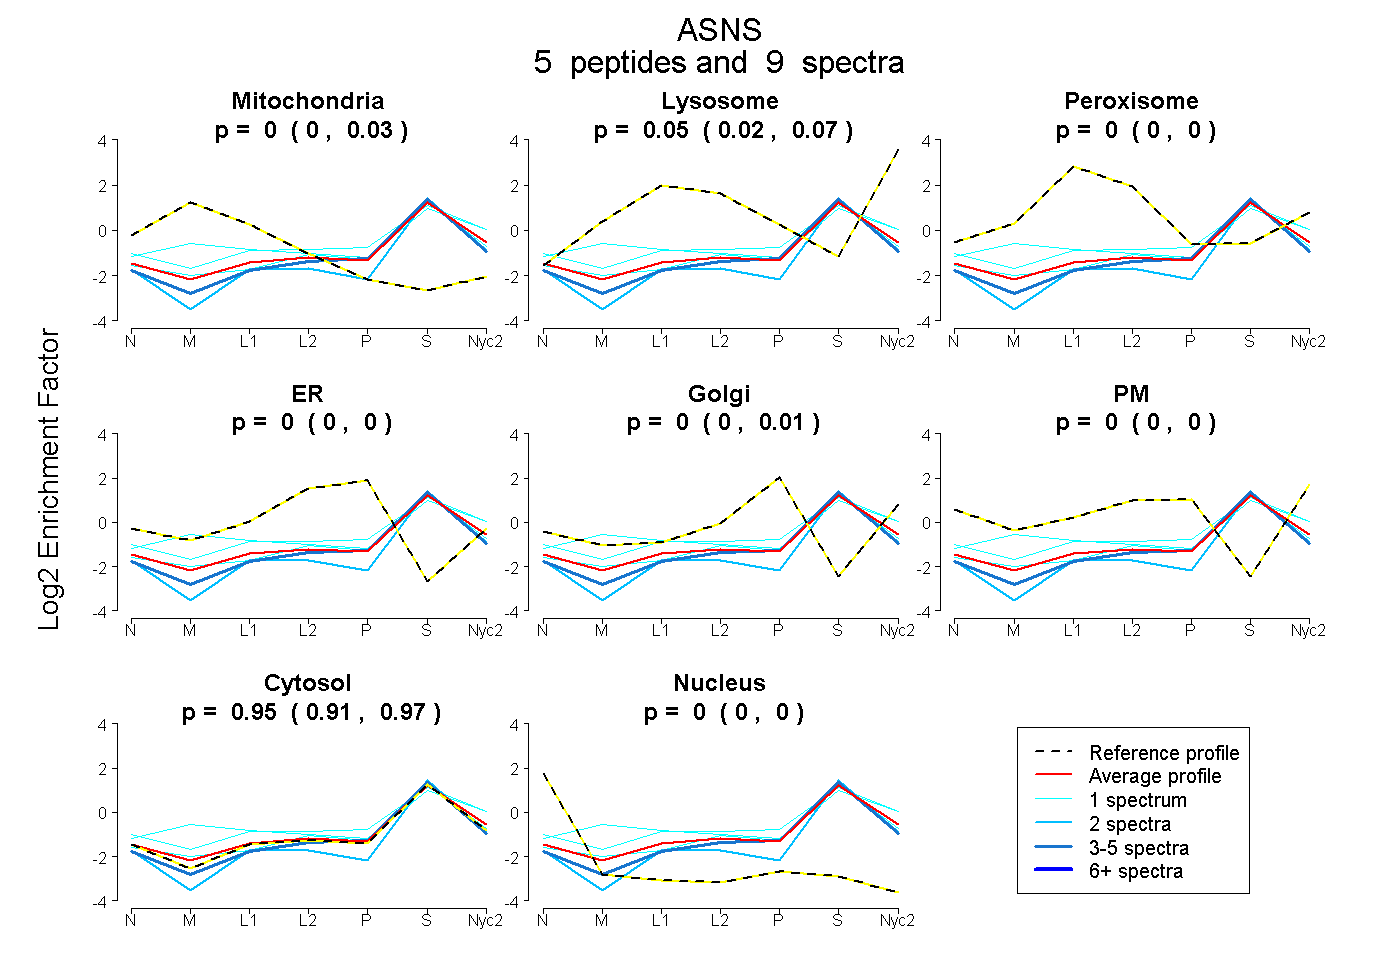
0.000 | 0.034
0.024 | 0.066
0.000 | 0.000
0.000 | 0.000
0.000 | 0.012
0.000 | 0.000
0.909 | 0.966
0.000 | 0.000
| Plot | Mito | Lyso | Perox | ER | Golgi | PM | Cytosol | Nucleus | |||||
| Expt A |
5 peptides |
9 spectra |
|
0.005 0.000 | 0.034 |
0.050 0.024 | 0.066 |
0.000 0.000 | 0.000 |
0.000 0.000 | 0.000 |
0.000 0.000 | 0.012 |
0.000 0.000 | 0.000 |
0.946 0.909 | 0.966 |
0.000 0.000 | 0.000 |
| 1 spectrum, EILWRPK | 0.017 | 0.027 | 0.000 | 0.000 | 0.003 | 0.000 | 0.953 | 0.000 | ||
| 1 spectrum, EGYYYR | 0.000 | 0.135 | 0.007 | 0.000 | 0.000 | 0.067 | 0.790 | 0.000 | ||
| 1 spectrum, LFPGFEIETVK | 0.139 | 0.188 | 0.000 | 0.000 | 0.000 | 0.000 | 0.674 | 0.000 | ||
| 4 spectra, VPFLDHR | 0.000 | 0.000 | 0.000 | 0.000 | 0.000 | 0.000 | 1.000 | 0.000 | ||
| 2 spectra, ELYLFDVLR | 0.000 | 0.000 | 0.000 | 0.000 | 0.000 | 0.000 | 0.977 | 0.023 |
| Plot | Lyso | Other | |||||||||||
| Expt C |
3 peptides |
14 spectra |
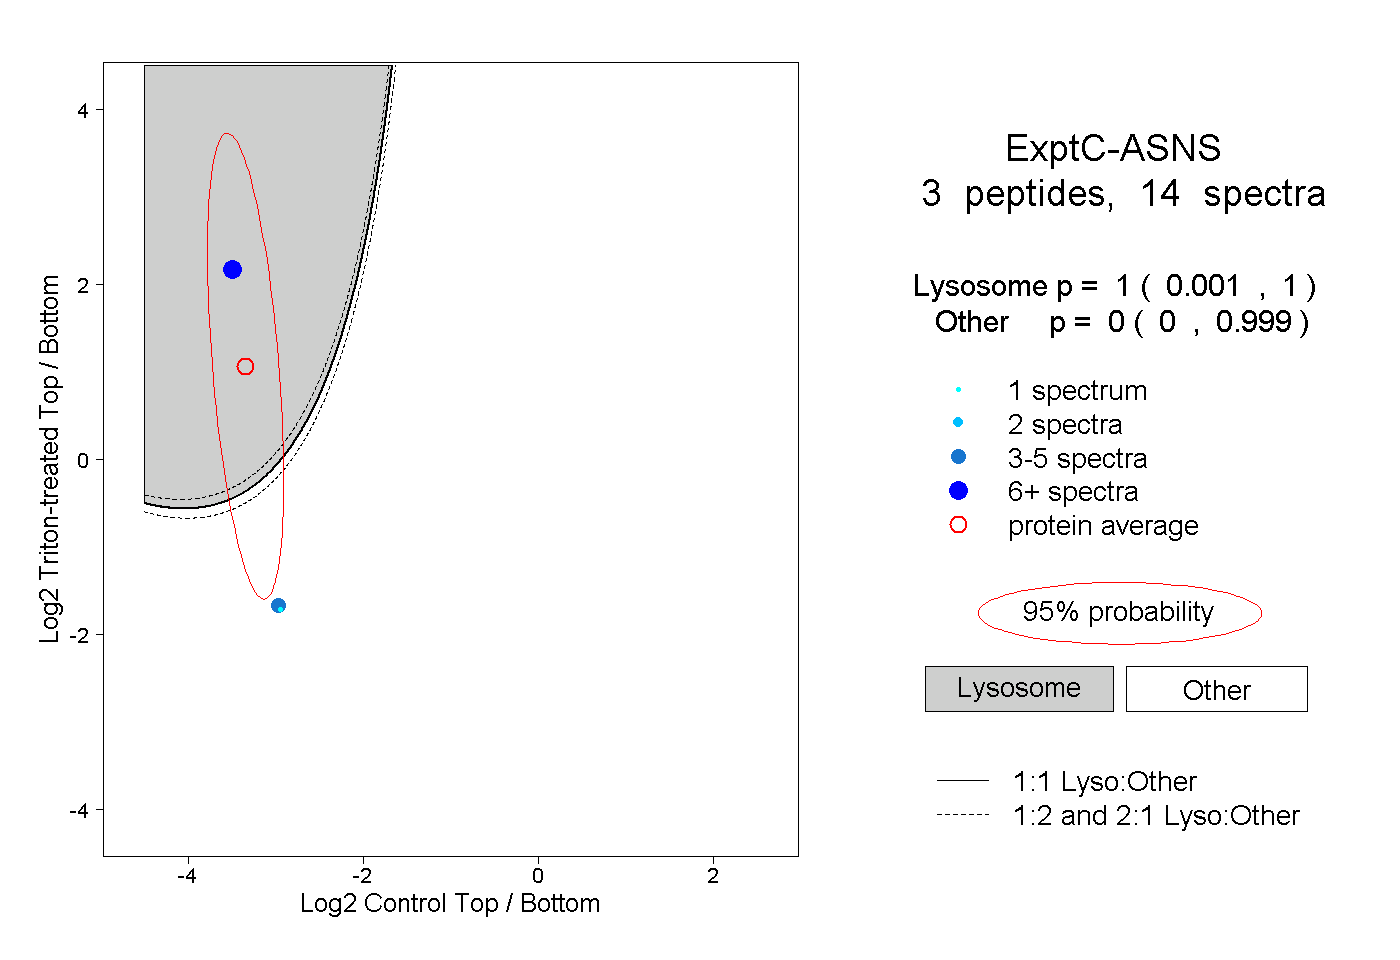 |
1.000 0.001 | 1.000 |
0.000 0.000 | 0.999 |