 5
5peptides
spectra
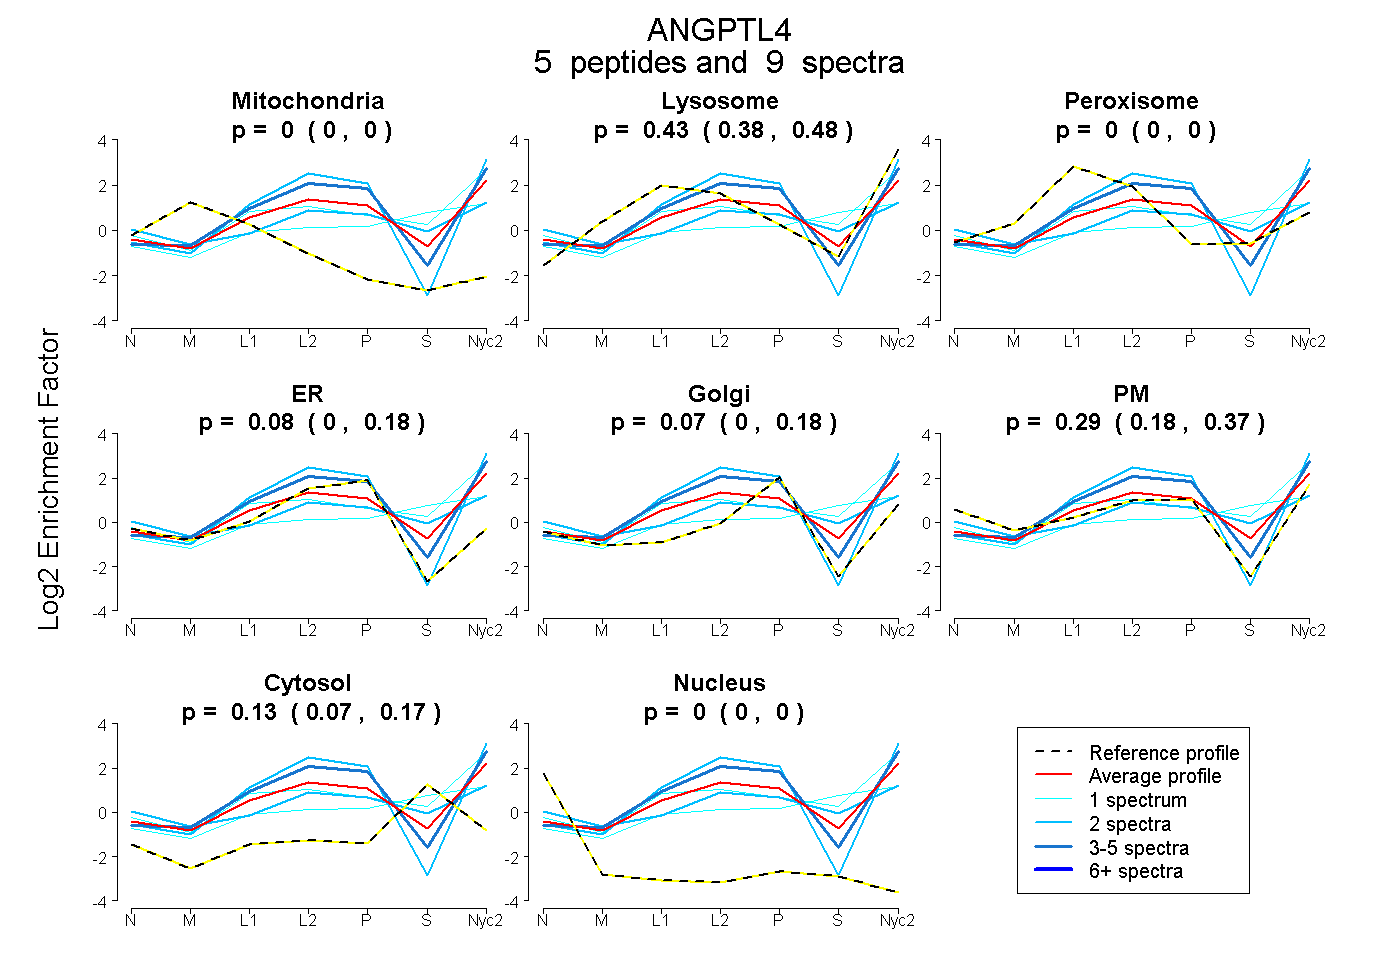
0.000 | 0.000
0.380 | 0.475
0.000 | 0.000
0.000 | 0.183
0.000 | 0.179
0.182 | 0.371
0.071 | 0.174
0.000 | 0.000
4peptides
spectra
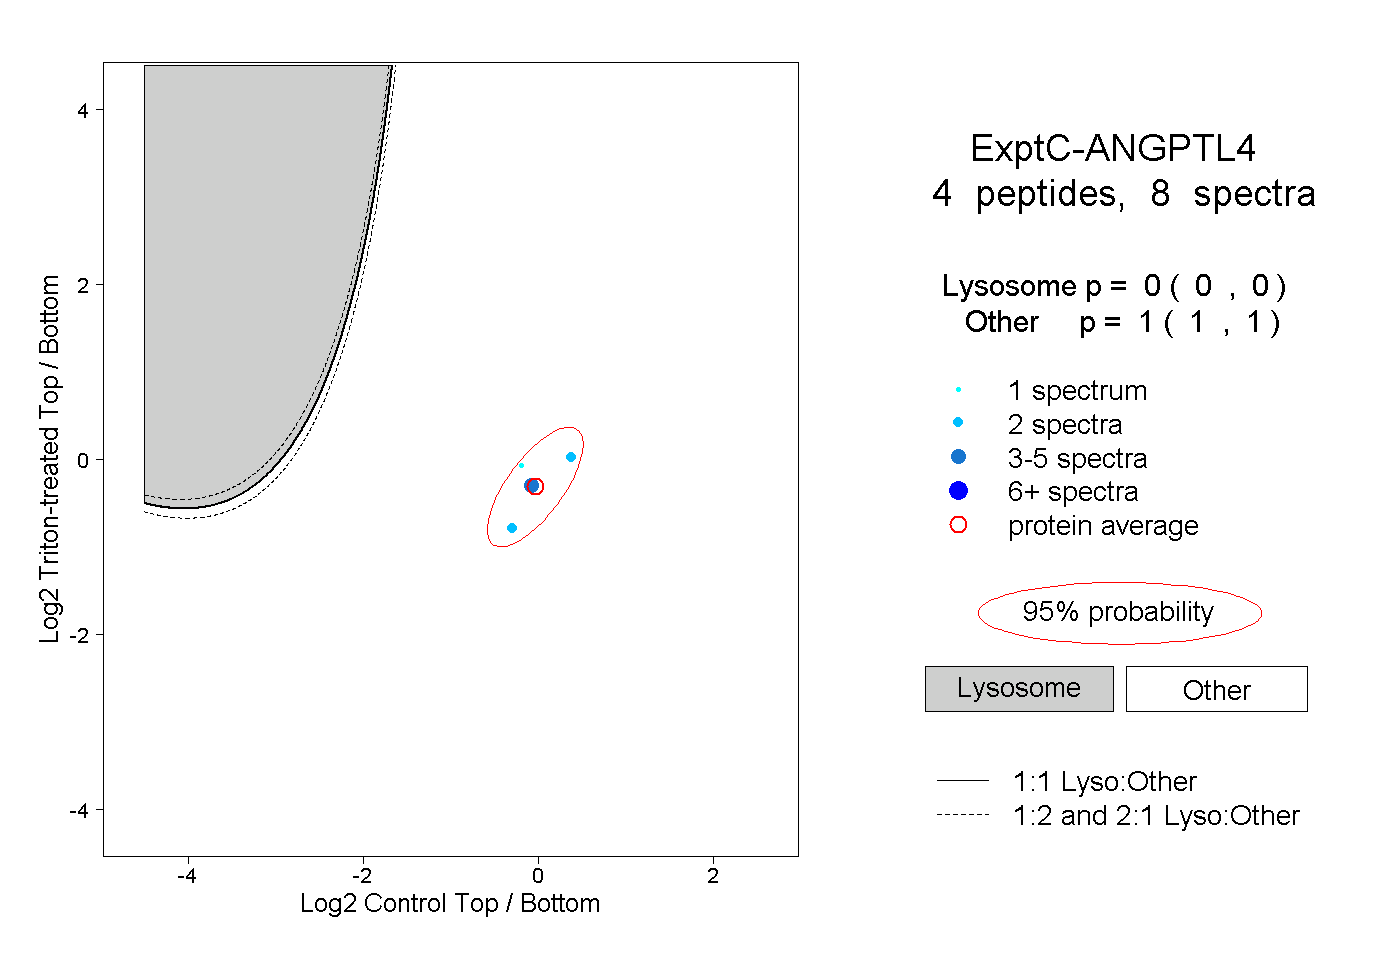
0.000 | 0.000
1.000 | 1.000
1peptide
spectrum
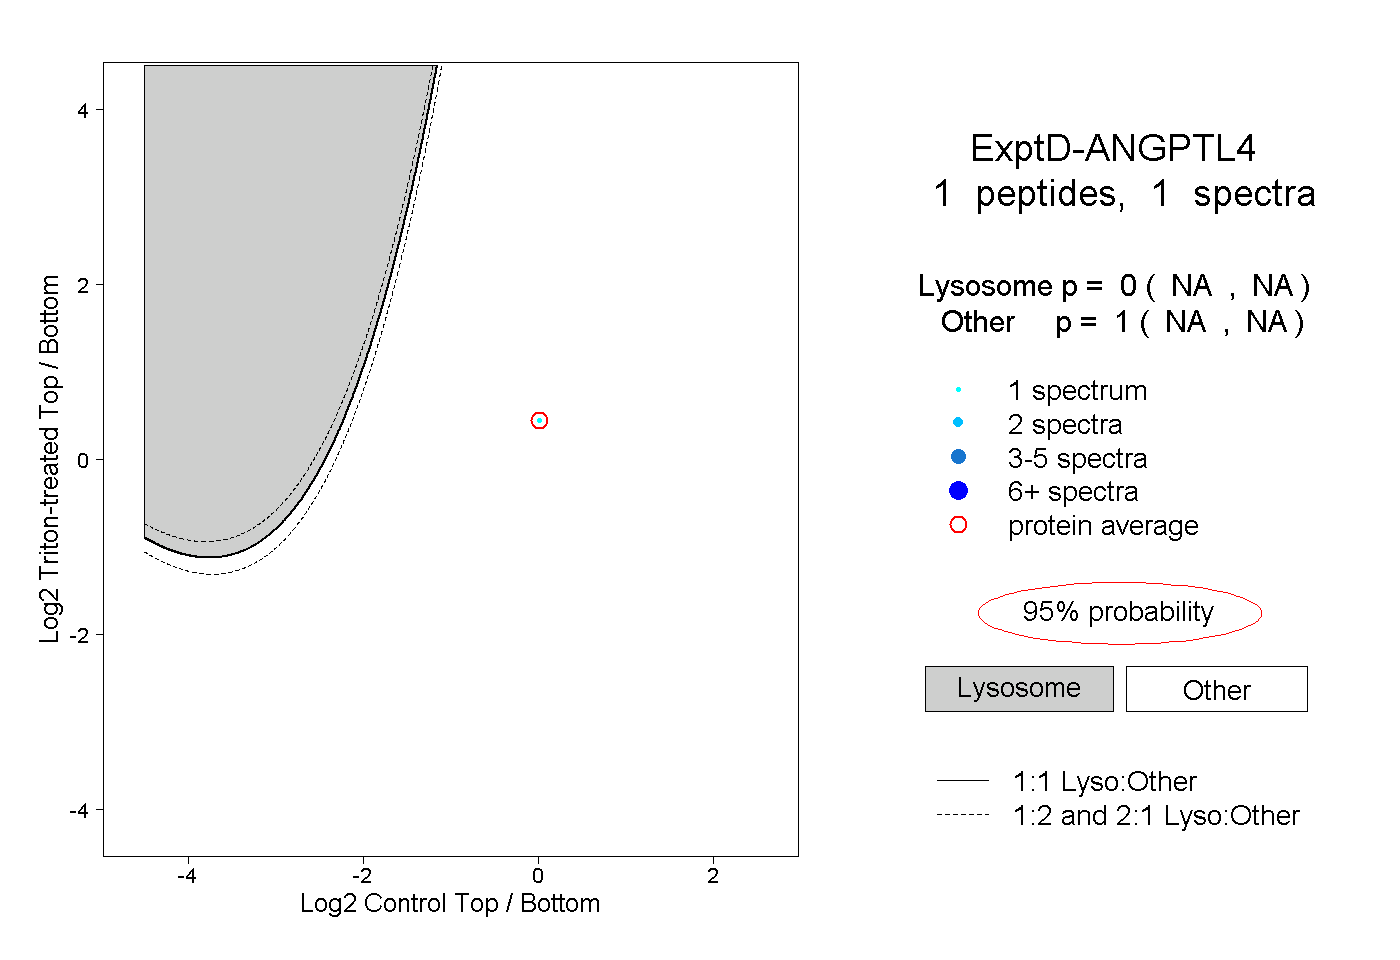
NA | NA
NA | NA