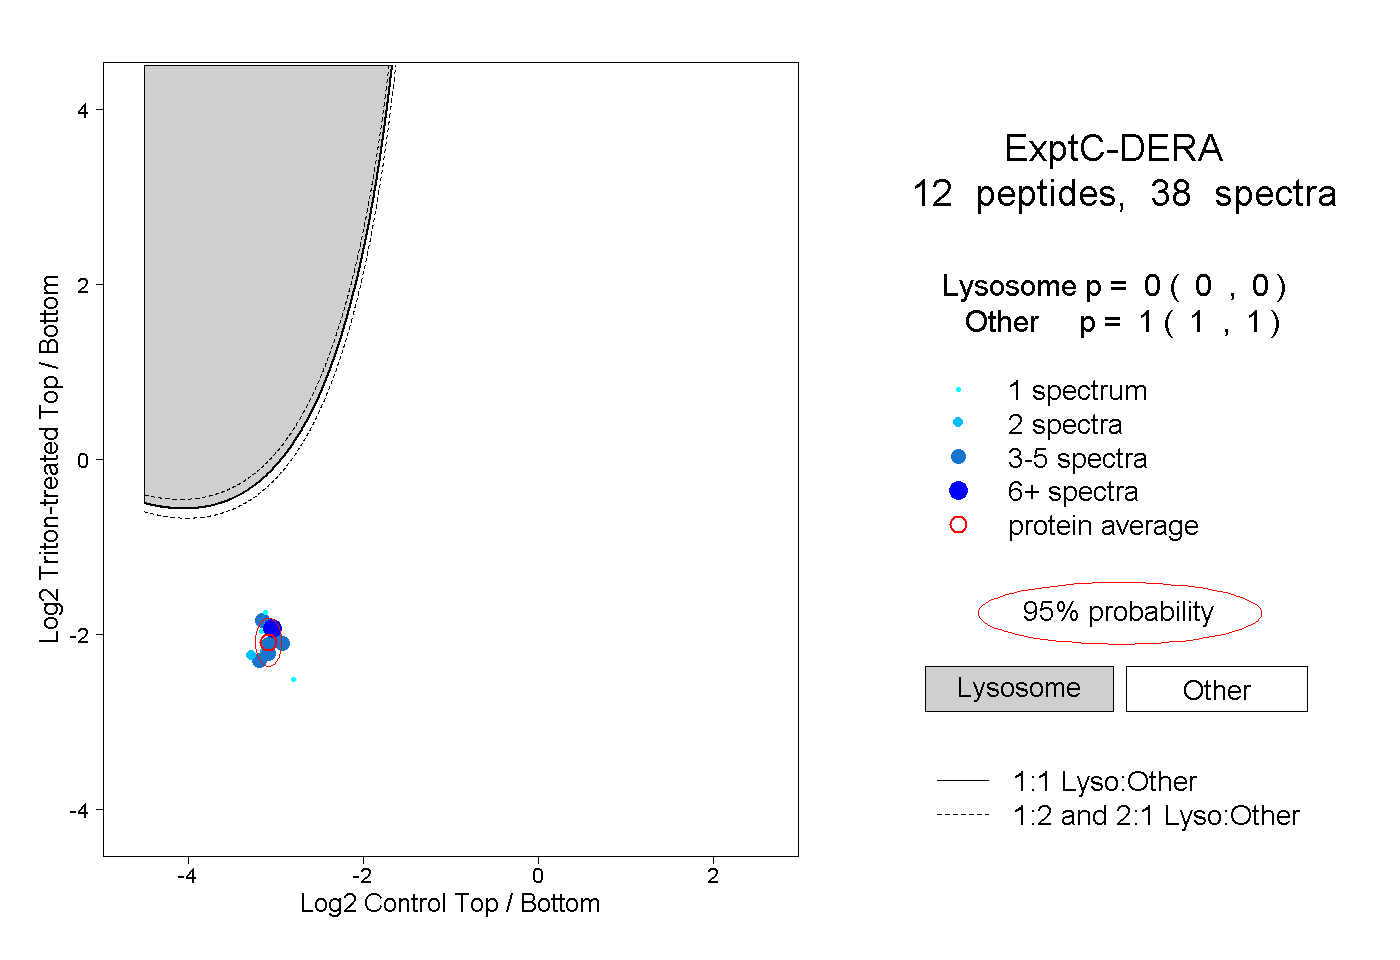
16
16peptides
spectra
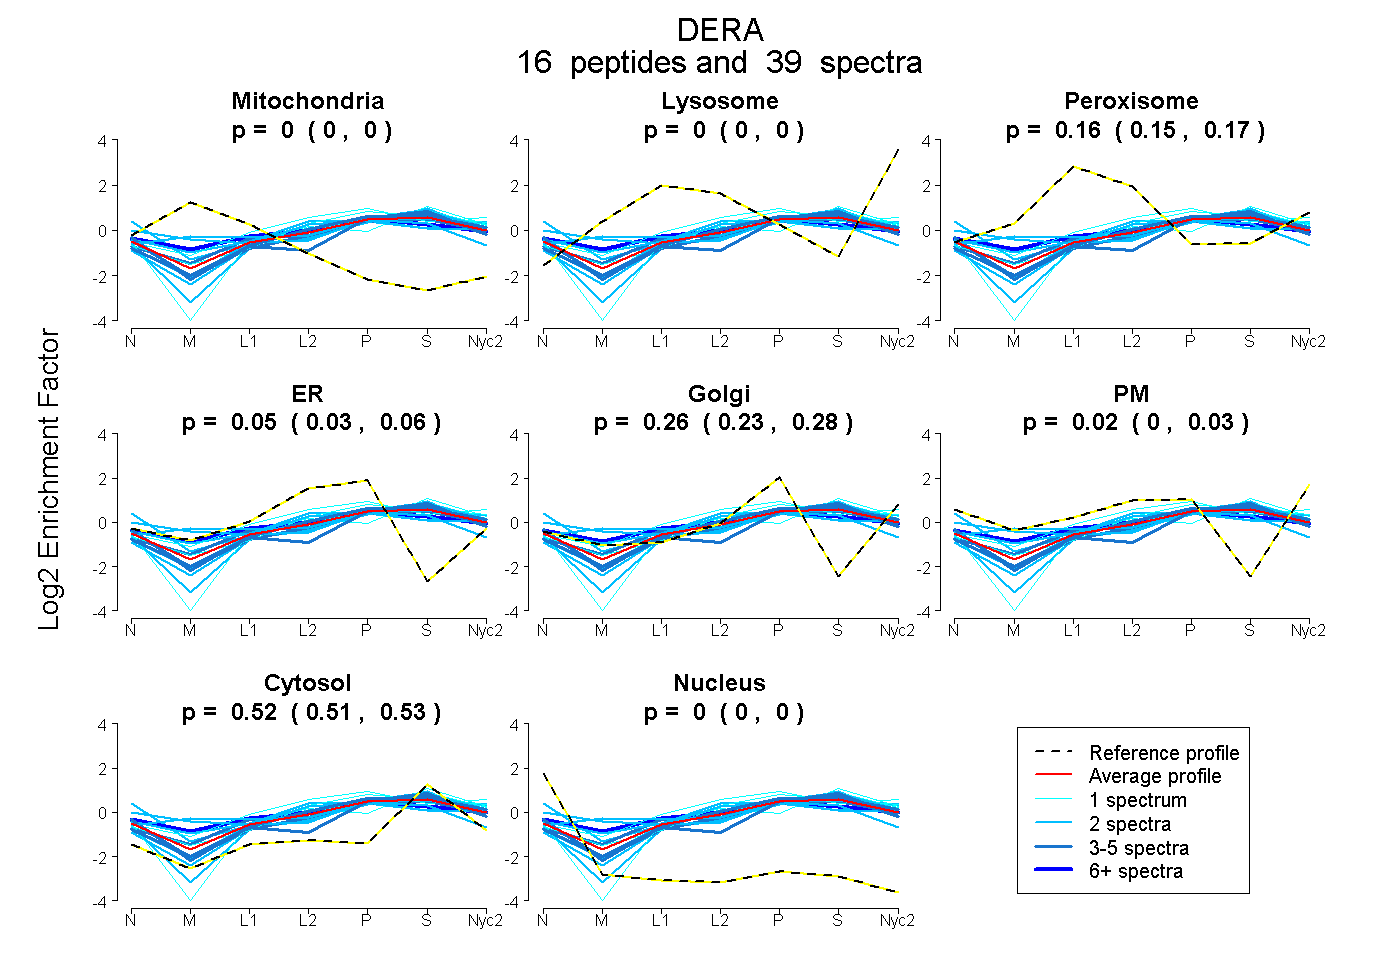
0.000 | 0.000
0.000 | 0.000
0.145 | 0.169
0.027 | 0.062
0.232 | 0.280
0.000 | 0.034
0.512 | 0.527
0.000 | 0.000
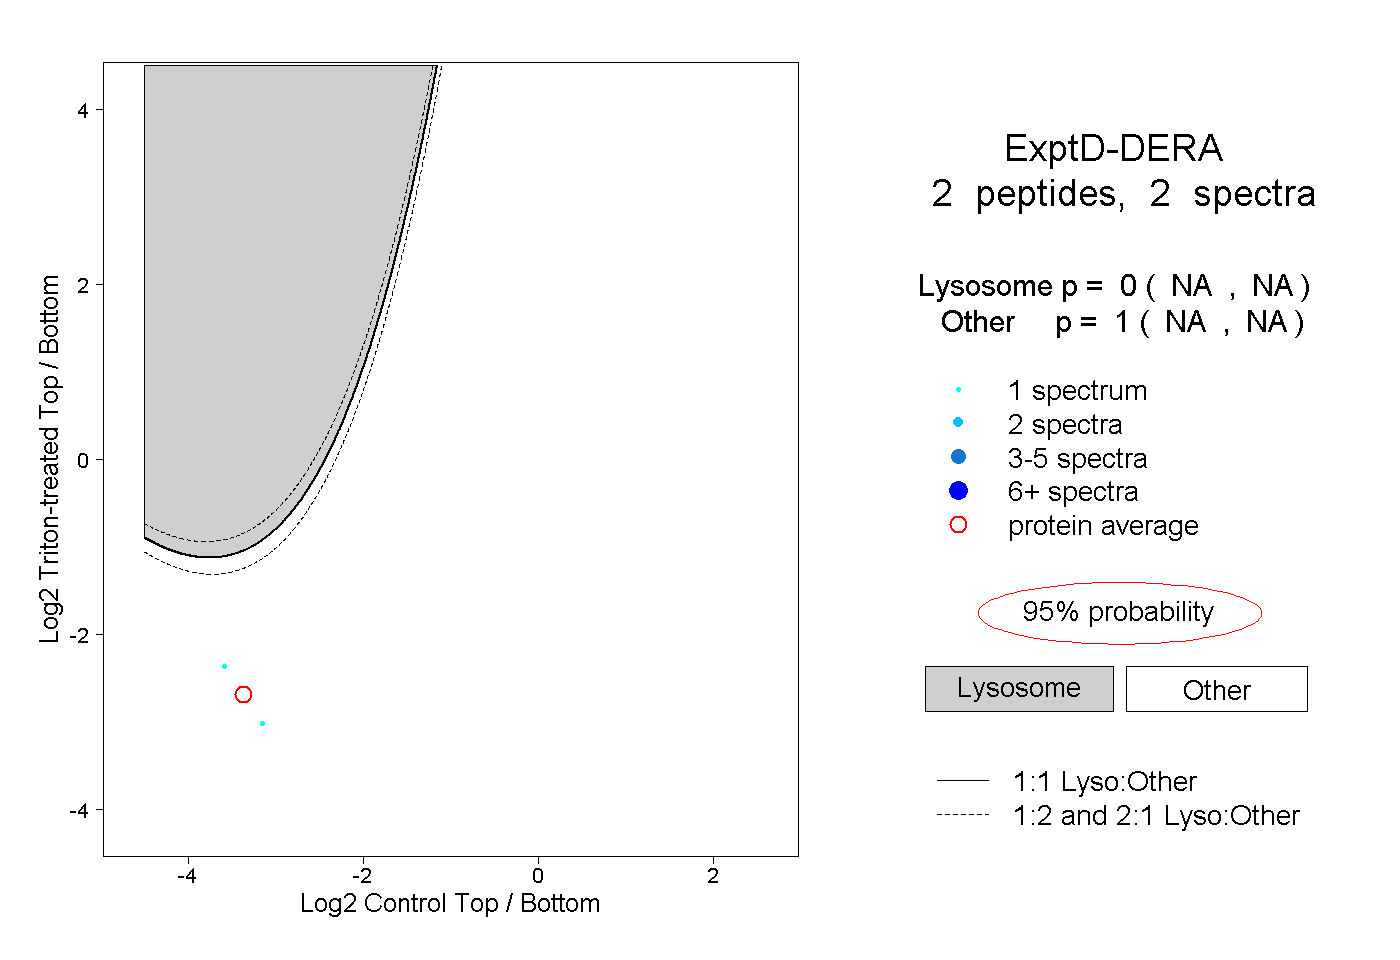
7peptides
spectra
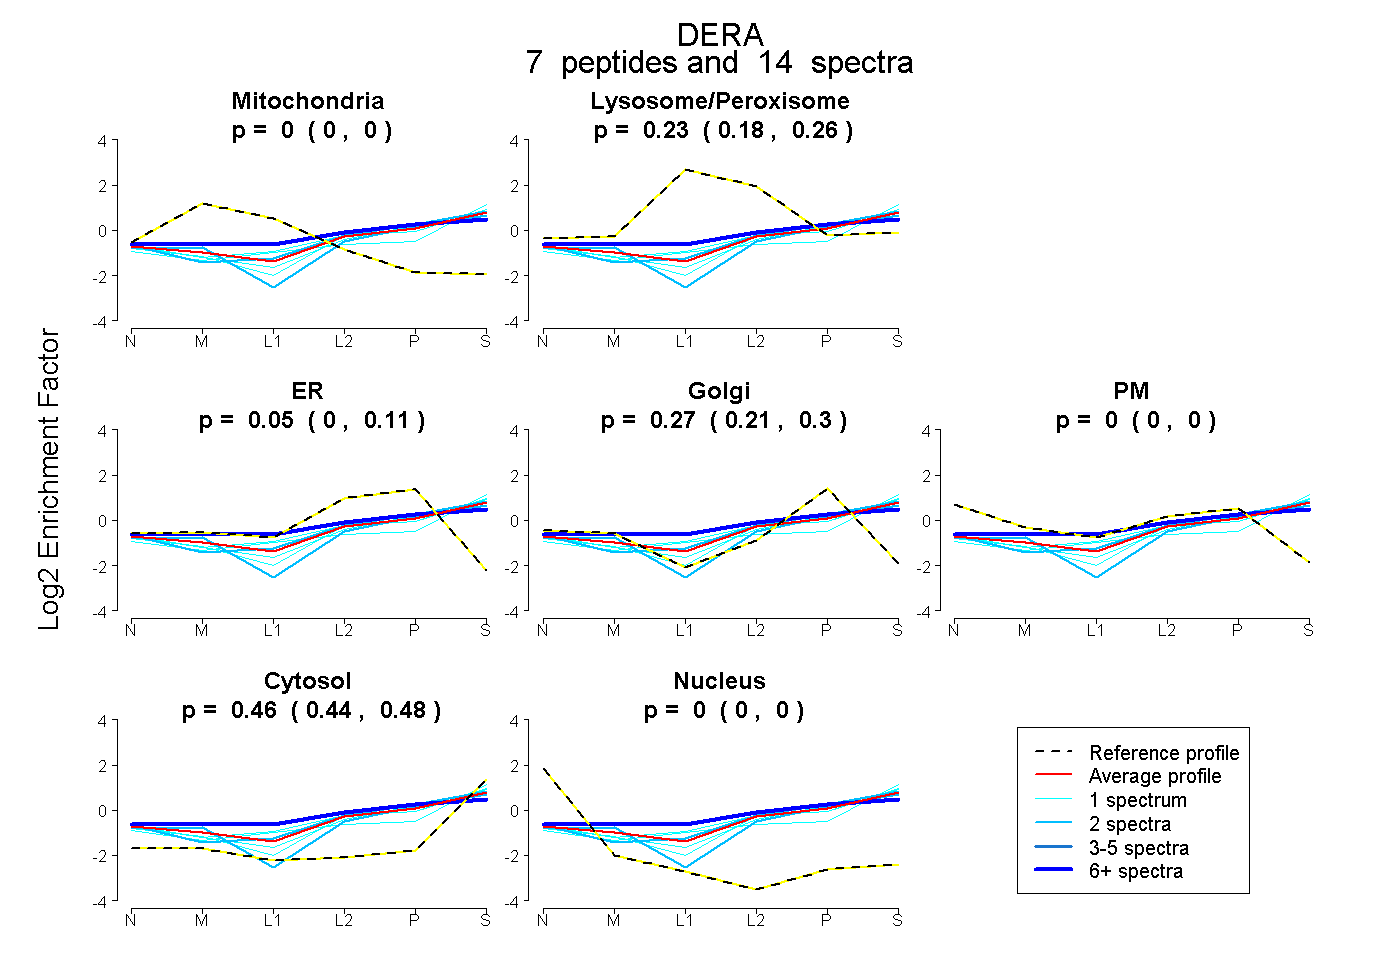
0.000 | 0.000
0.182 | 0.256
0.000 | 0.108
0.211 | 0.303
0.000 | 0.000
0.443 | 0.481
0.000 | 0.000