 17
17peptides
spectra

0.000 | 0.000
0.000 | 0.000
0.000 | 0.000
0.789 | 0.802
0.000 | 0.000
0.000 | 0.000
0.005 | 0.024
0.180 | 0.195
5peptides
spectra

0.000 | 0.000
0.000 | 0.111
0.882 | 0.999
0.000 | 0.000
0.000 | 0.000
0.000 | 0.000
0.000 | 0.000
5peptides
spectra
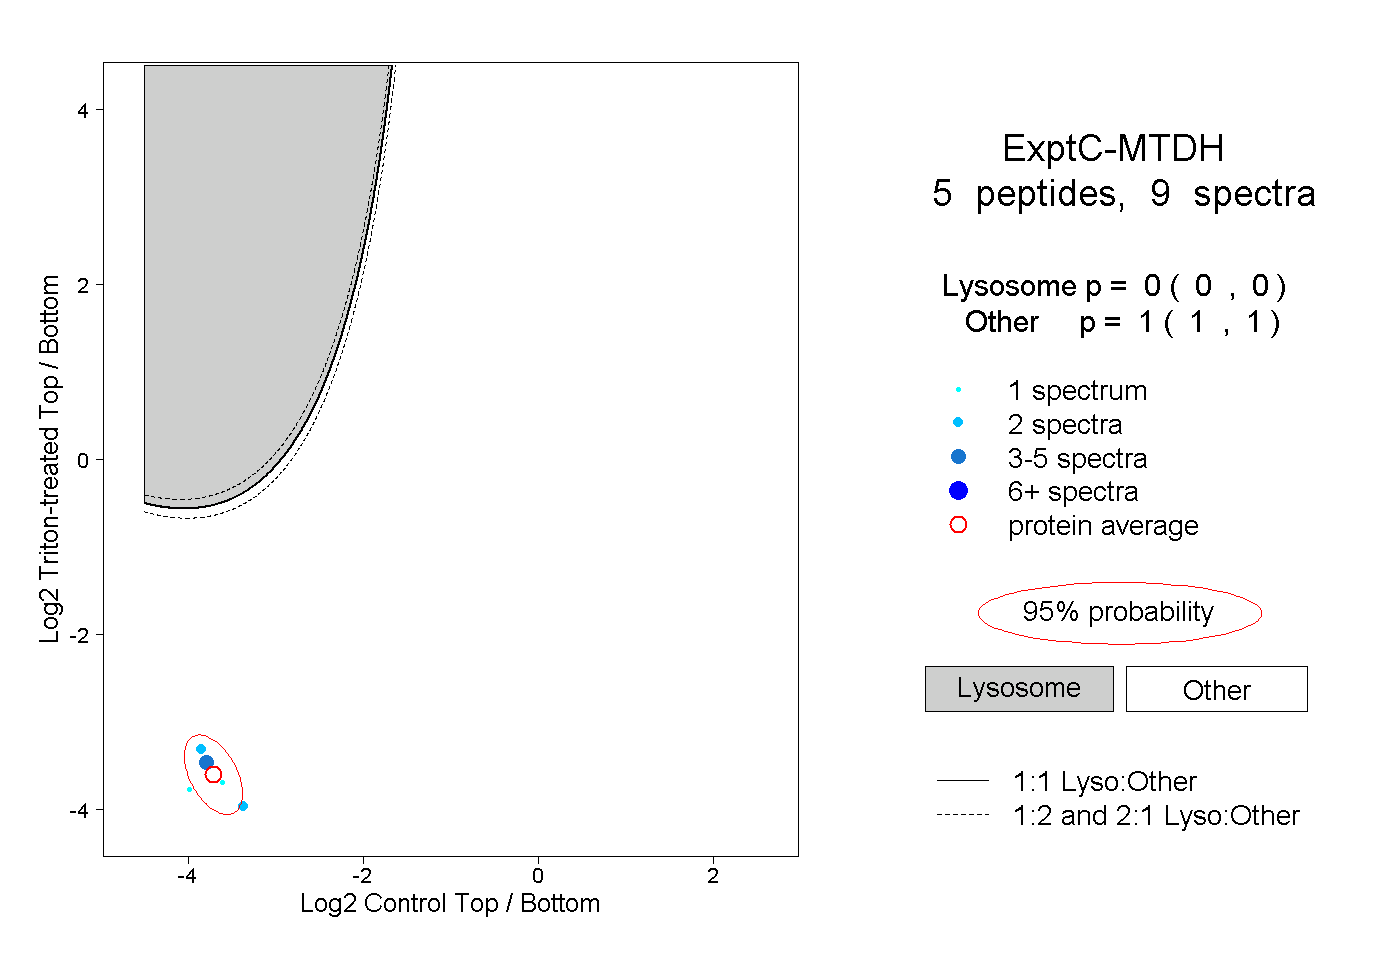
0.000 | 0.000
1.000 | 1.000
2peptides
spectra
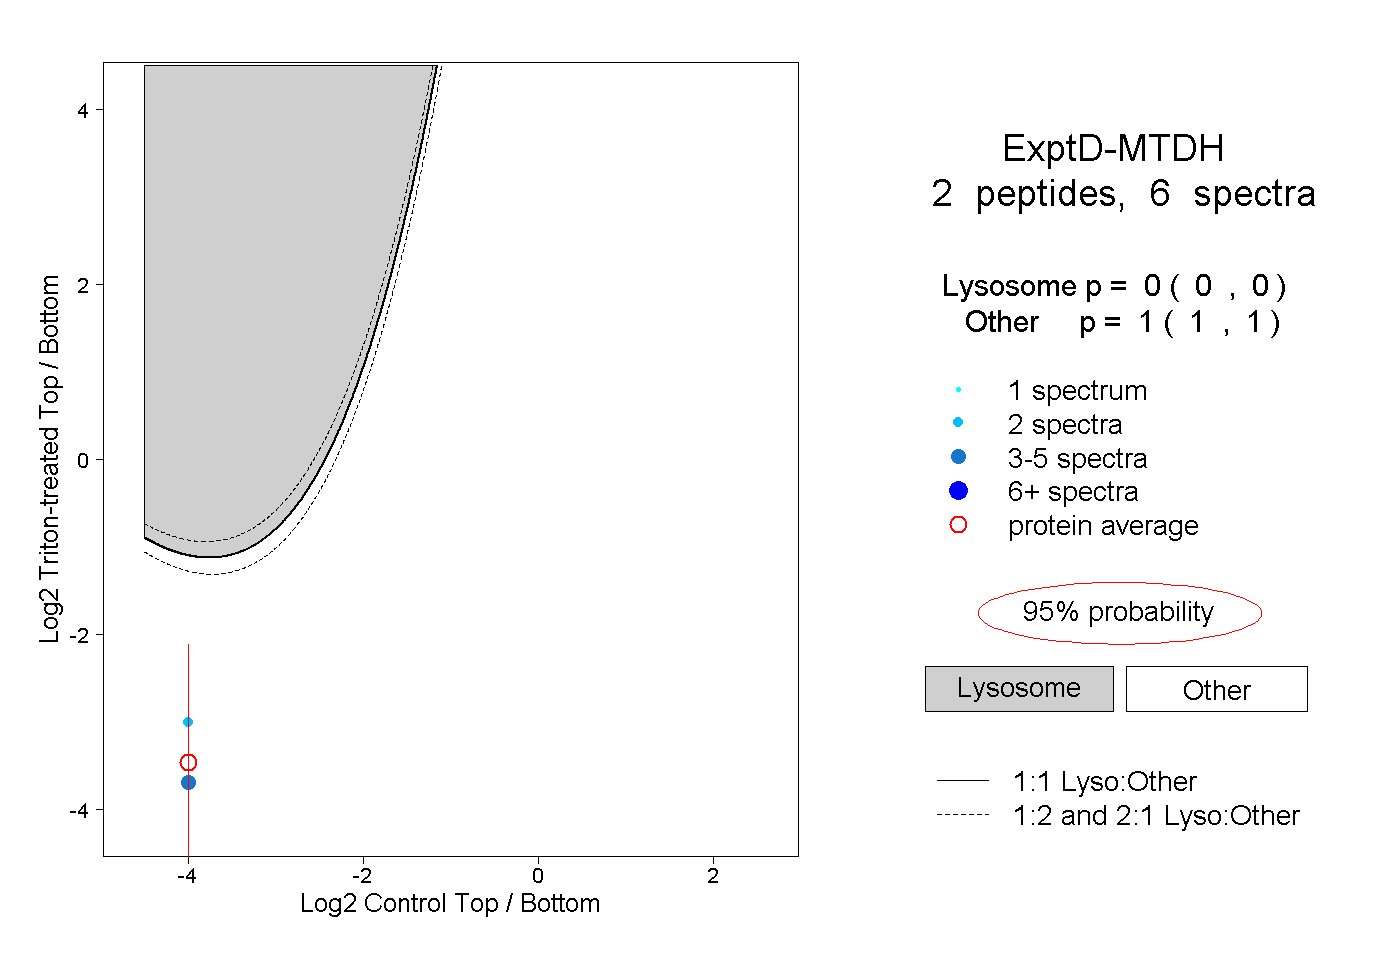
0.000 | 0.000
1.000 | 1.000