 4
4peptides
spectra
0.210 | 0.491
0.000 | 0.000
0.000 | 0.100
0.000 | 0.079
0.000 | 0.058
0.000 | 0.069
0.155 | 0.369
0.196 | 0.381
4peptides
spectra
0.000 | 0.000
1.000 | 1.000
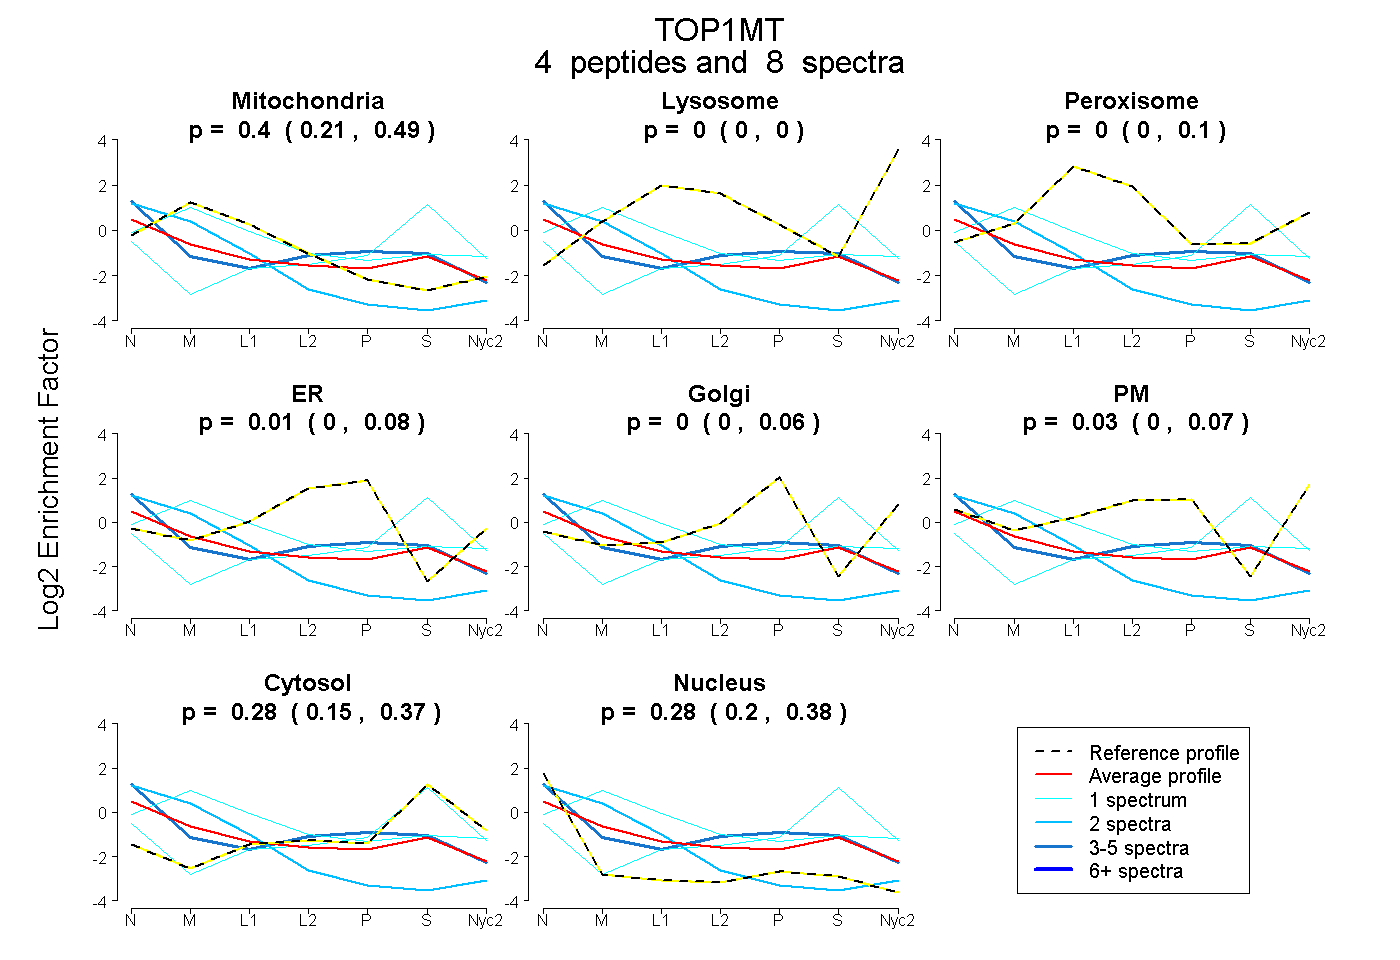
| Plot | Mito | Lyso | Perox | ER | Golgi | PM | Cytosol | Nucleus | |||||
| Expt A |
4 peptides |
8 spectra |
|
0.397 0.210 | 0.491 |
0.000 0.000 | 0.000 |
0.000 0.000 | 0.100 |
0.015 0.000 | 0.079 |
0.000 0.000 | 0.058 |
0.028 0.000 | 0.069 |
0.282 0.155 | 0.369 |
0.278 0.196 | 0.381 |
||
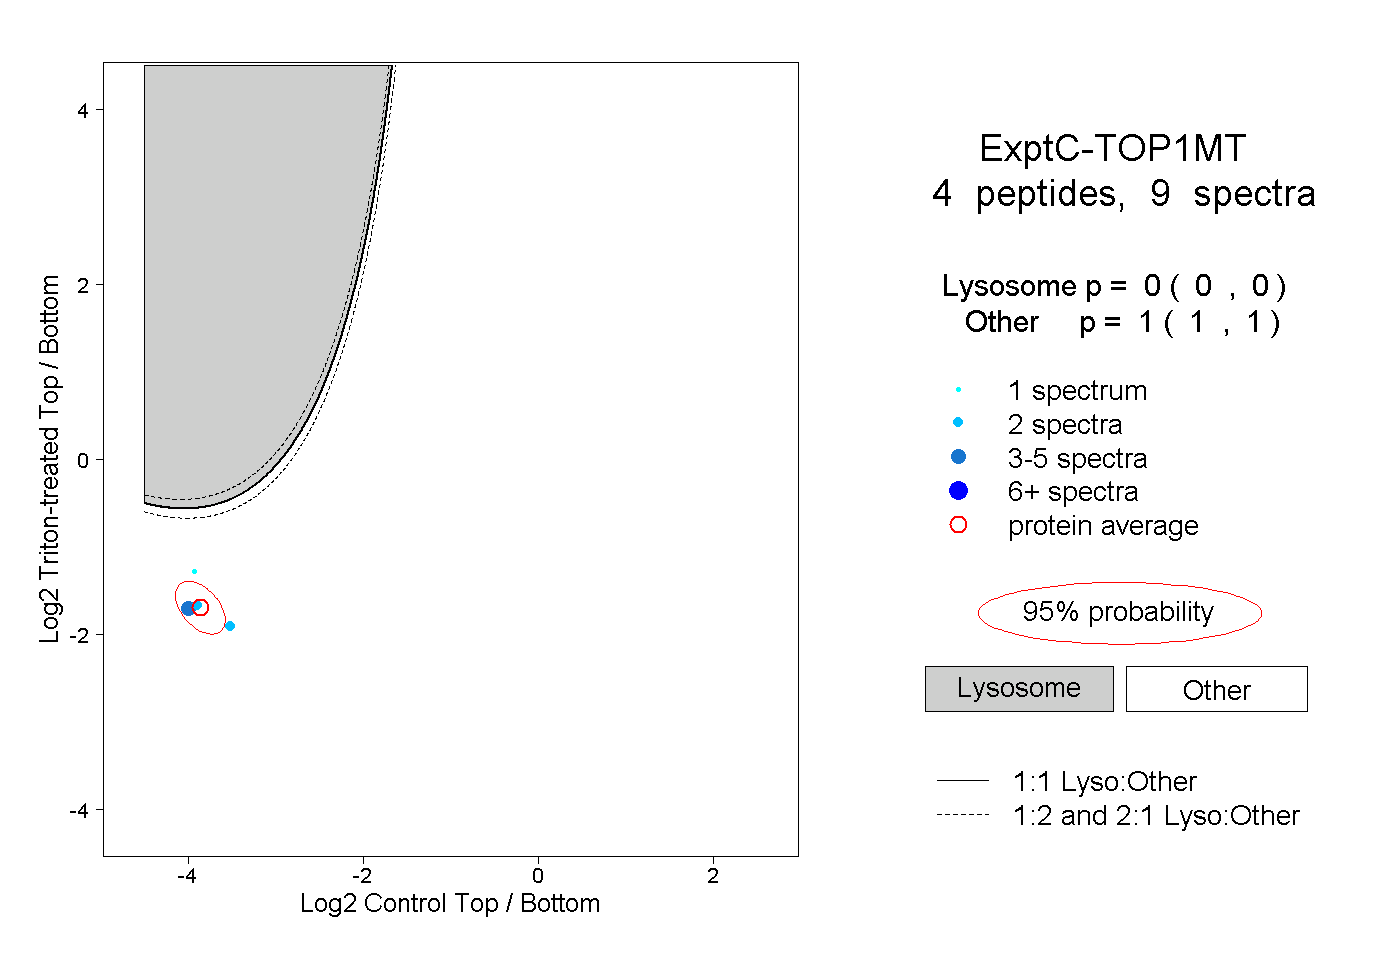
| Plot | Lyso | Other | |||||||||||
| Expt C |
4 peptides |
9 spectra |
|
0.000 0.000 | 0.000 |
1.000 1.000 | 1.000 |