 11
11peptides
spectra
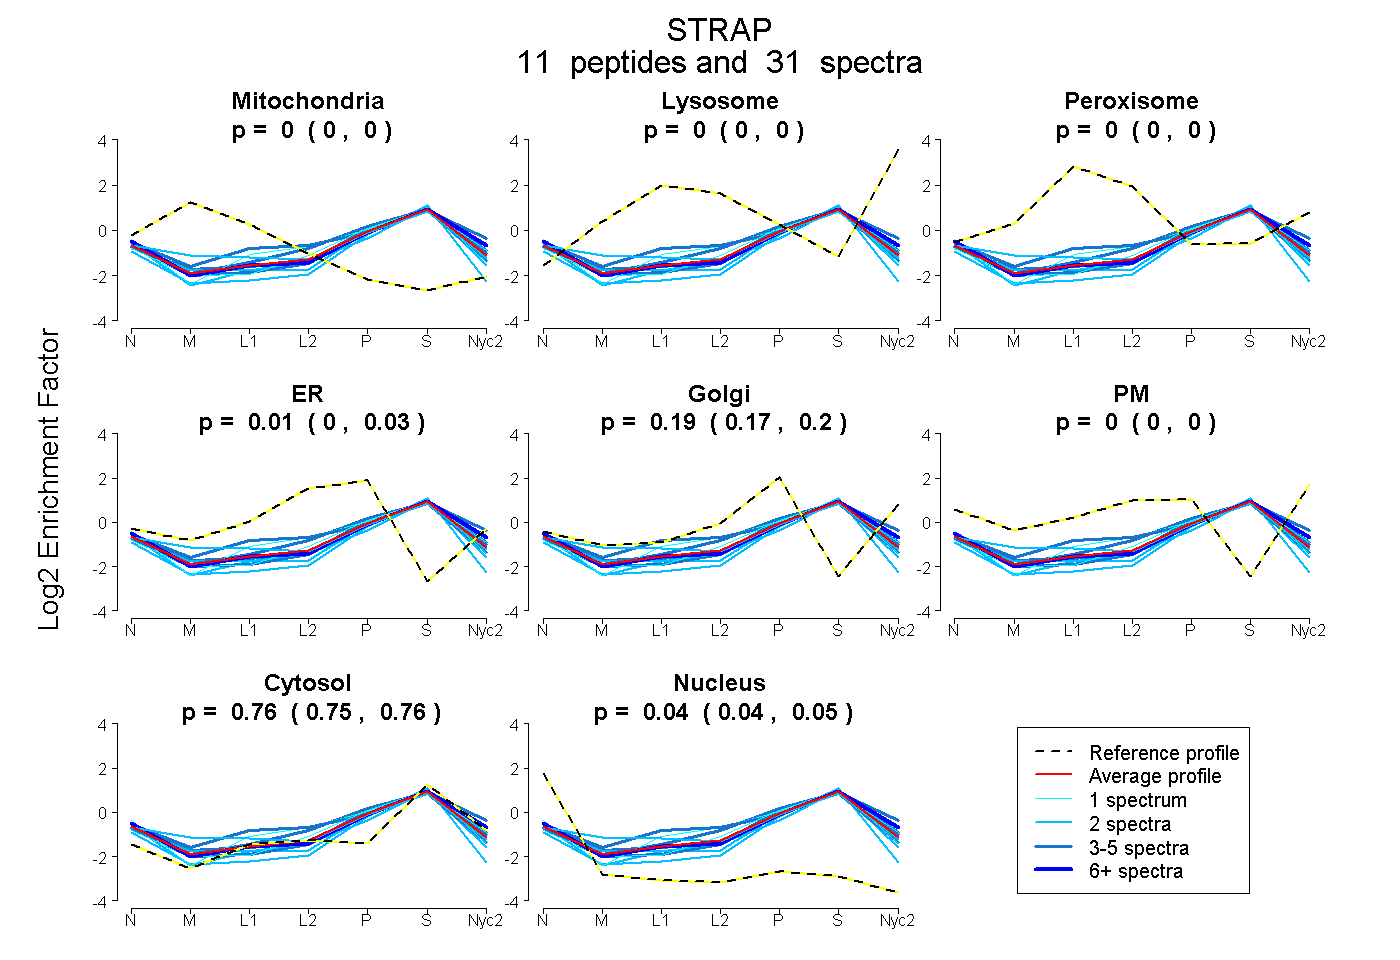
0.000 | 0.000
0.000 | 0.000
0.000 | 0.000
0.000 | 0.026
0.170 | 0.205
0.000 | 0.000
0.755 | 0.760
0.036 | 0.045
4peptides
spectra
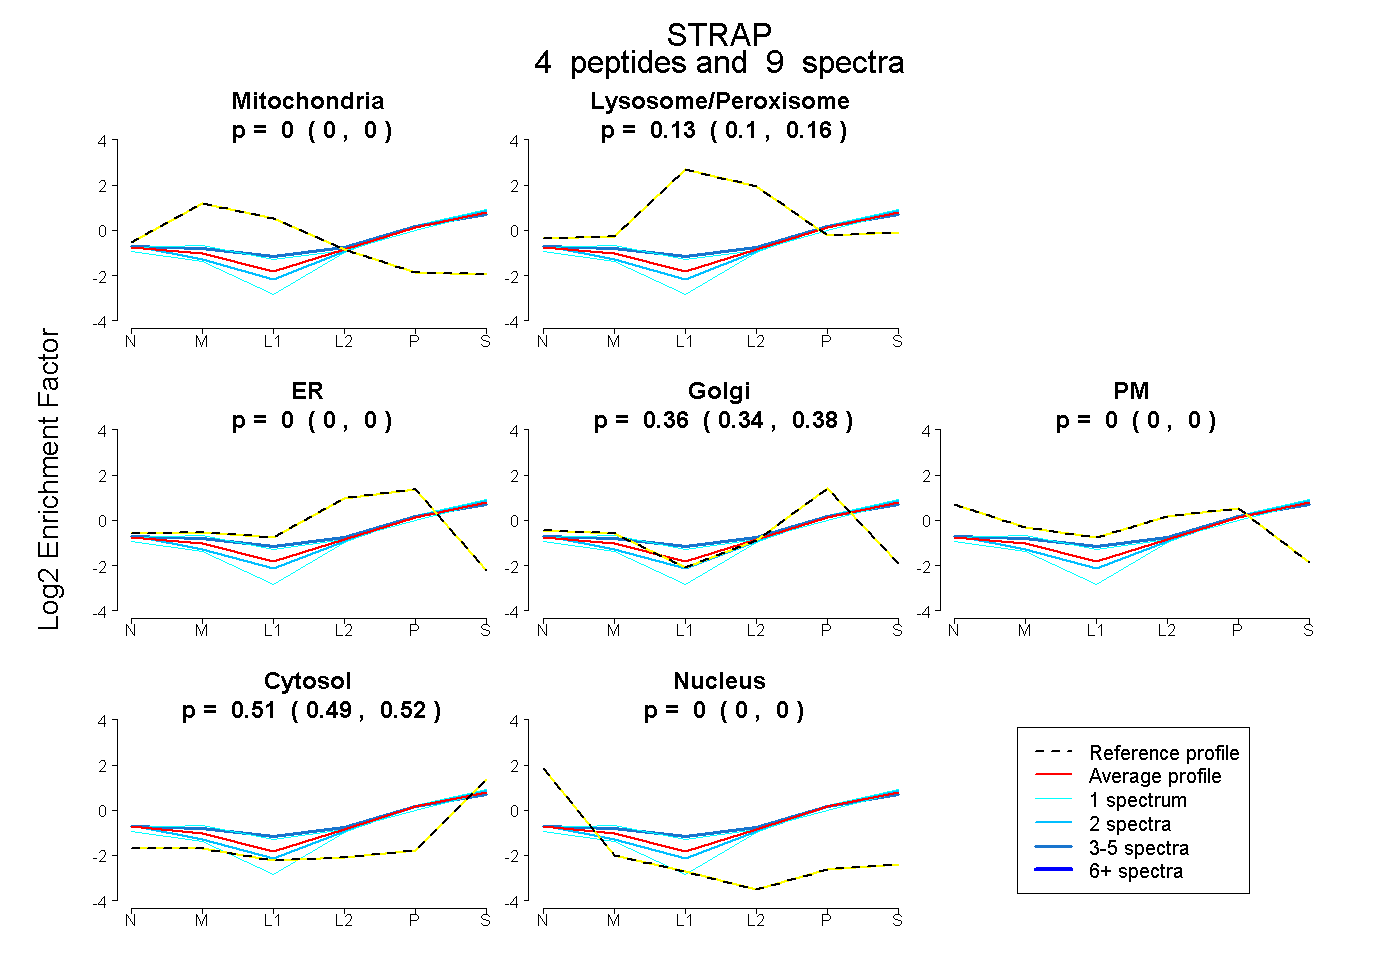
0.000 | 0.000
0.098 | 0.159
0.000 | 0.000
0.336 | 0.383
0.000 | 0.000
0.493 | 0.521
0.000 | 0.000
8peptides
spectra
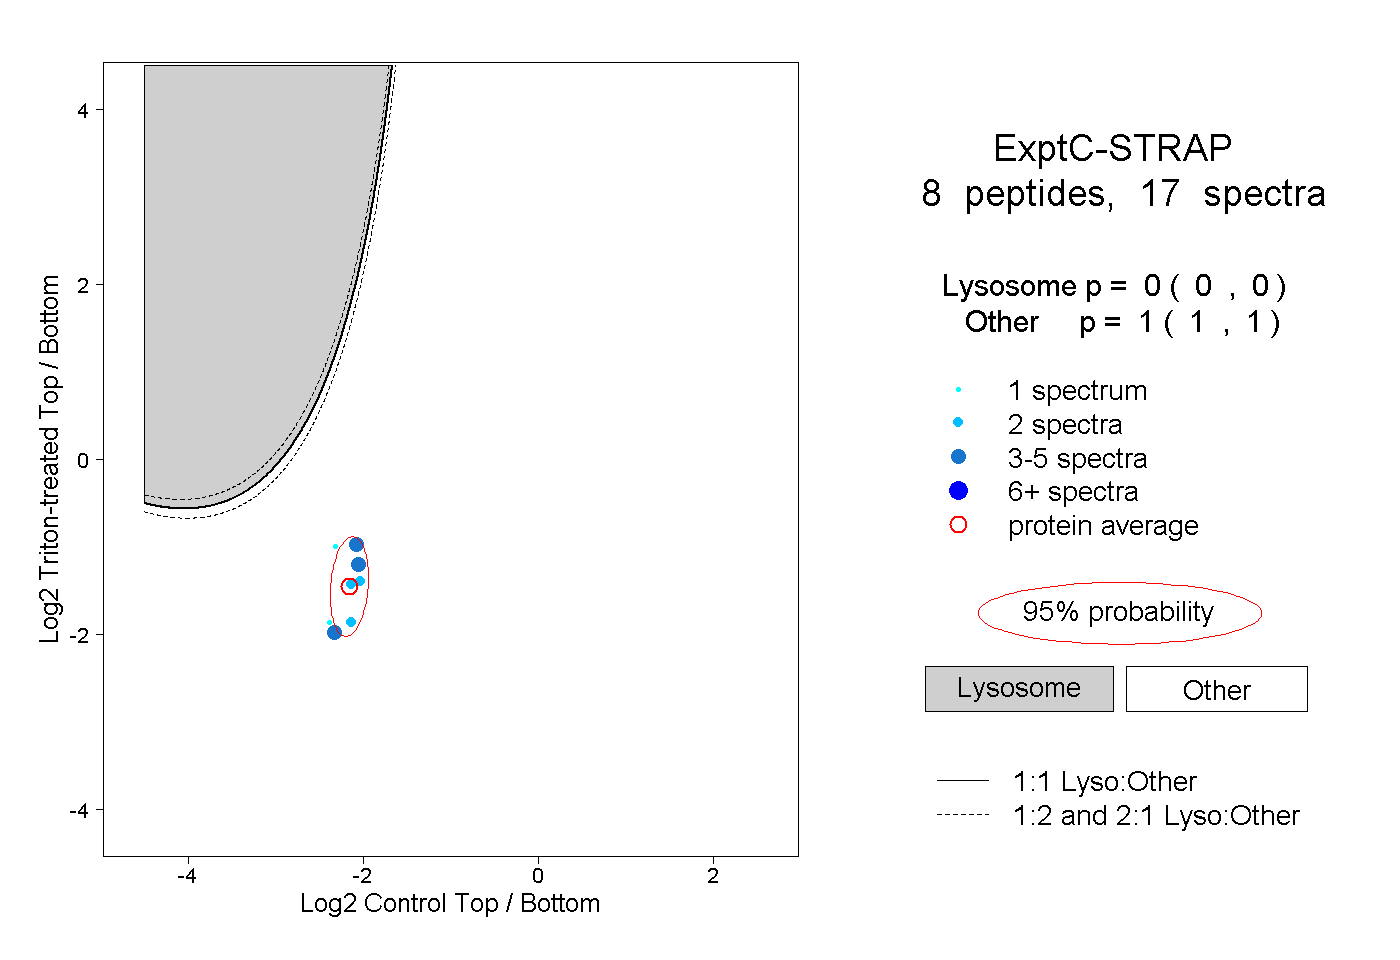
0.000 | 0.000
1.000 | 1.000
1peptide
spectra
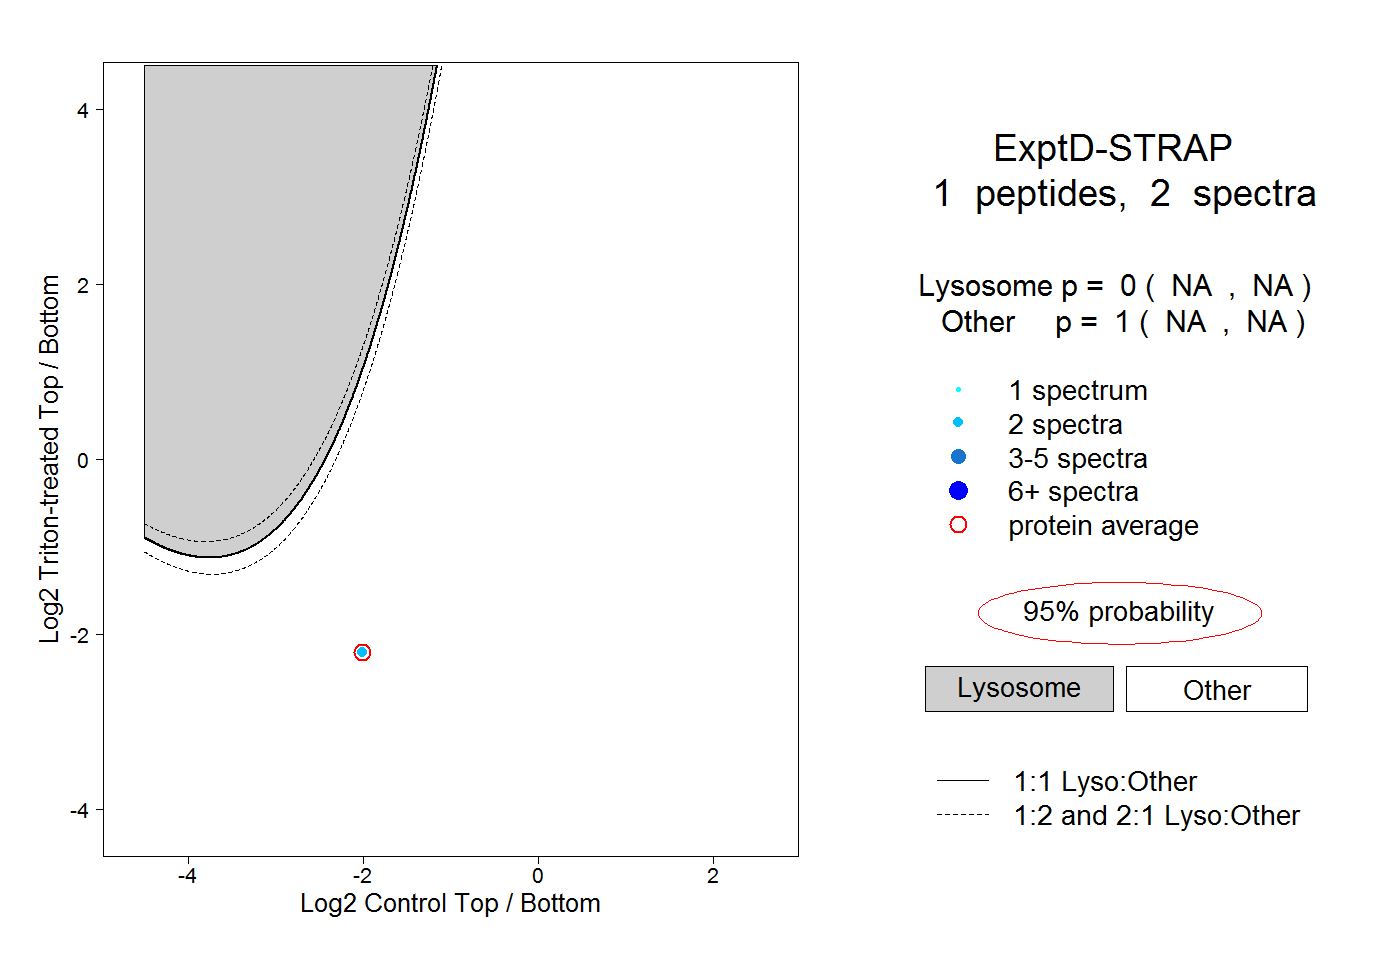
NA | NA
NA | NA