 2
2peptides
spectra
0.000 | 0.167
0.000 | 0.247
0.000 | 0.237
0.000 | 0.055
0.000 | 0.308
0.000 | 0.417
0.187 | 0.459
0.000 | 0.000
1peptide
spectrum
NA | NA
NA | NA
| Plot | Mito | Lyso | Perox | ER | Golgi | PM | Cytosol | Nucleus | |||||
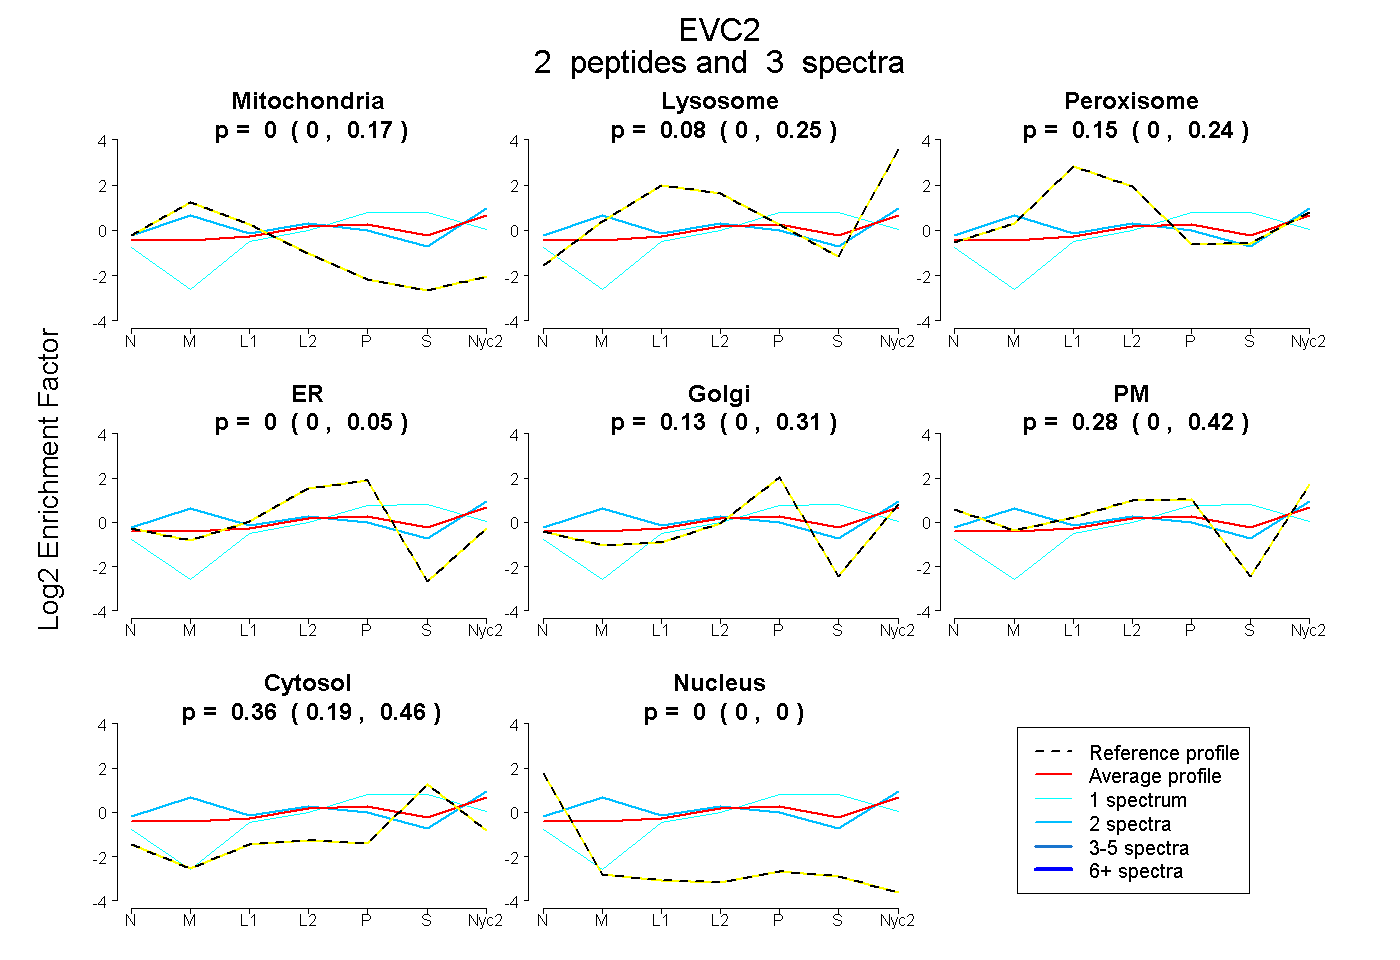
| Expt A |
2 peptides |
3 spectra |
|
0.004 0.000 | 0.167 |
0.078 0.000 | 0.247 |
0.151 0.000 | 0.237 |
0.000 0.000 | 0.055 |
0.133 0.000 | 0.308 |
0.277 0.000 | 0.417 |
0.357 0.187 | 0.459 |
0.000 0.000 | 0.000 |
||
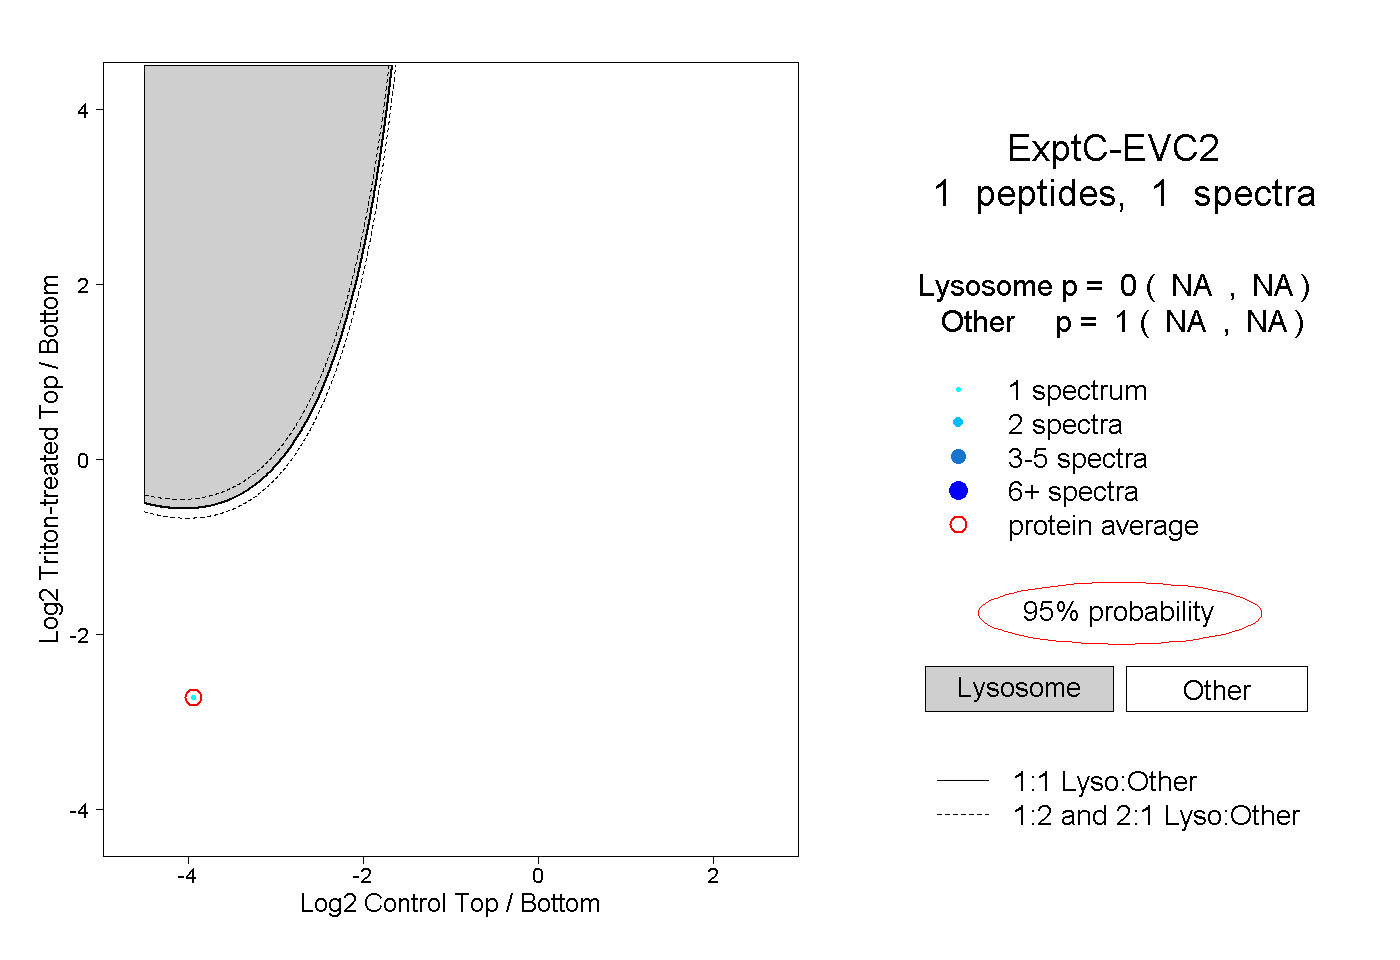
| Plot | Lyso | Other | |||||||||||
| Expt C |
1 peptide |
1 spectrum |
|
0.000 NA | NA |
1.000 NA | NA |