 26
26peptides
spectra
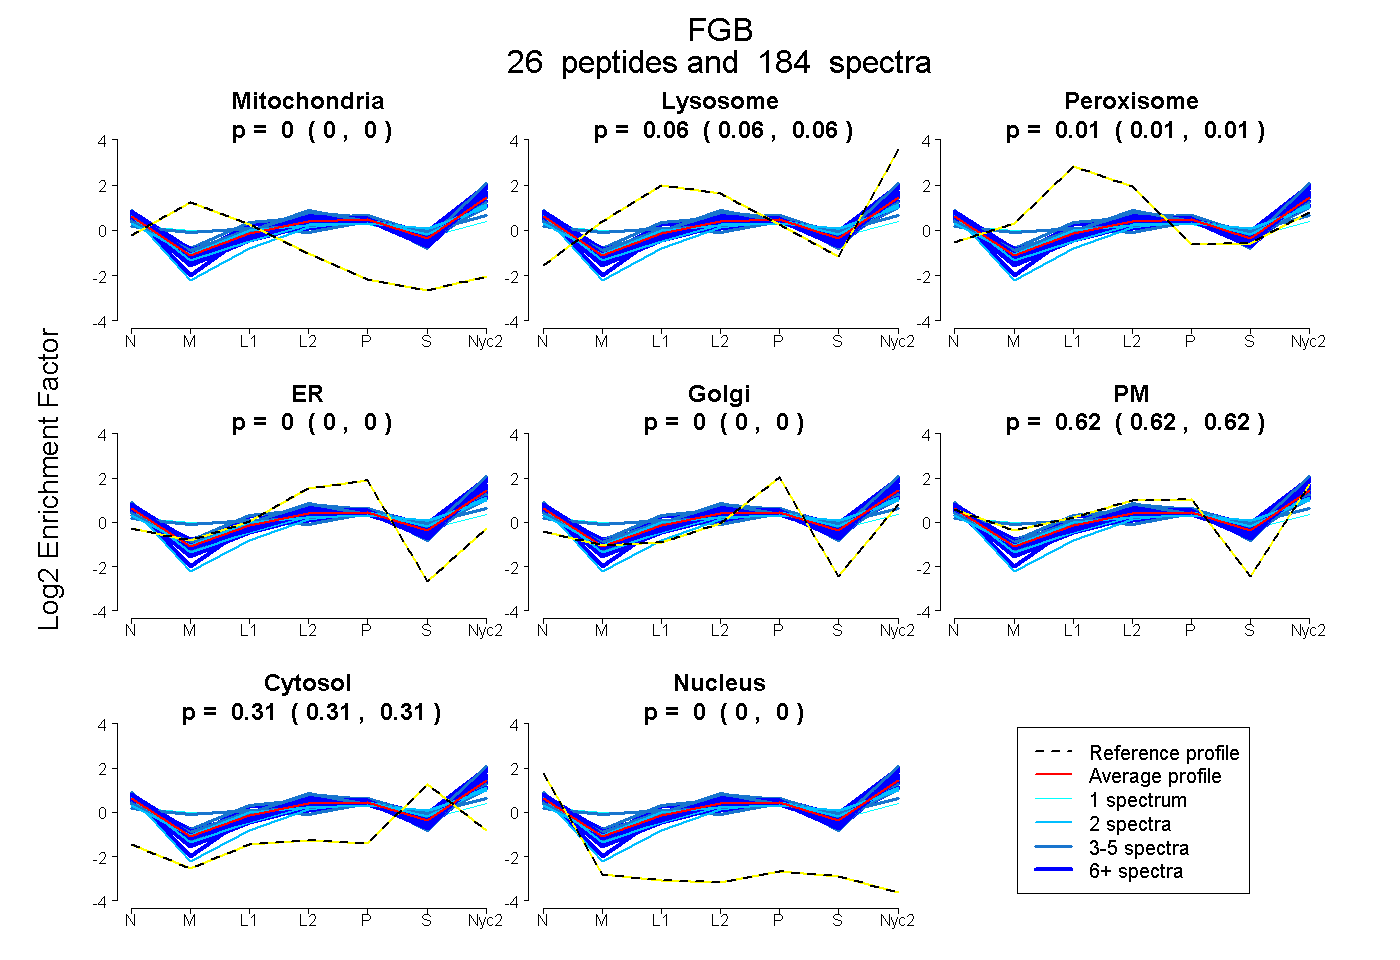
0.000 | 0.000
0.057 | 0.063
0.006 | 0.011
0.000 | 0.000
0.000 | 0.000
0.621 | 0.624
0.307 | 0.309
0.000 | 0.000
11peptides
spectra
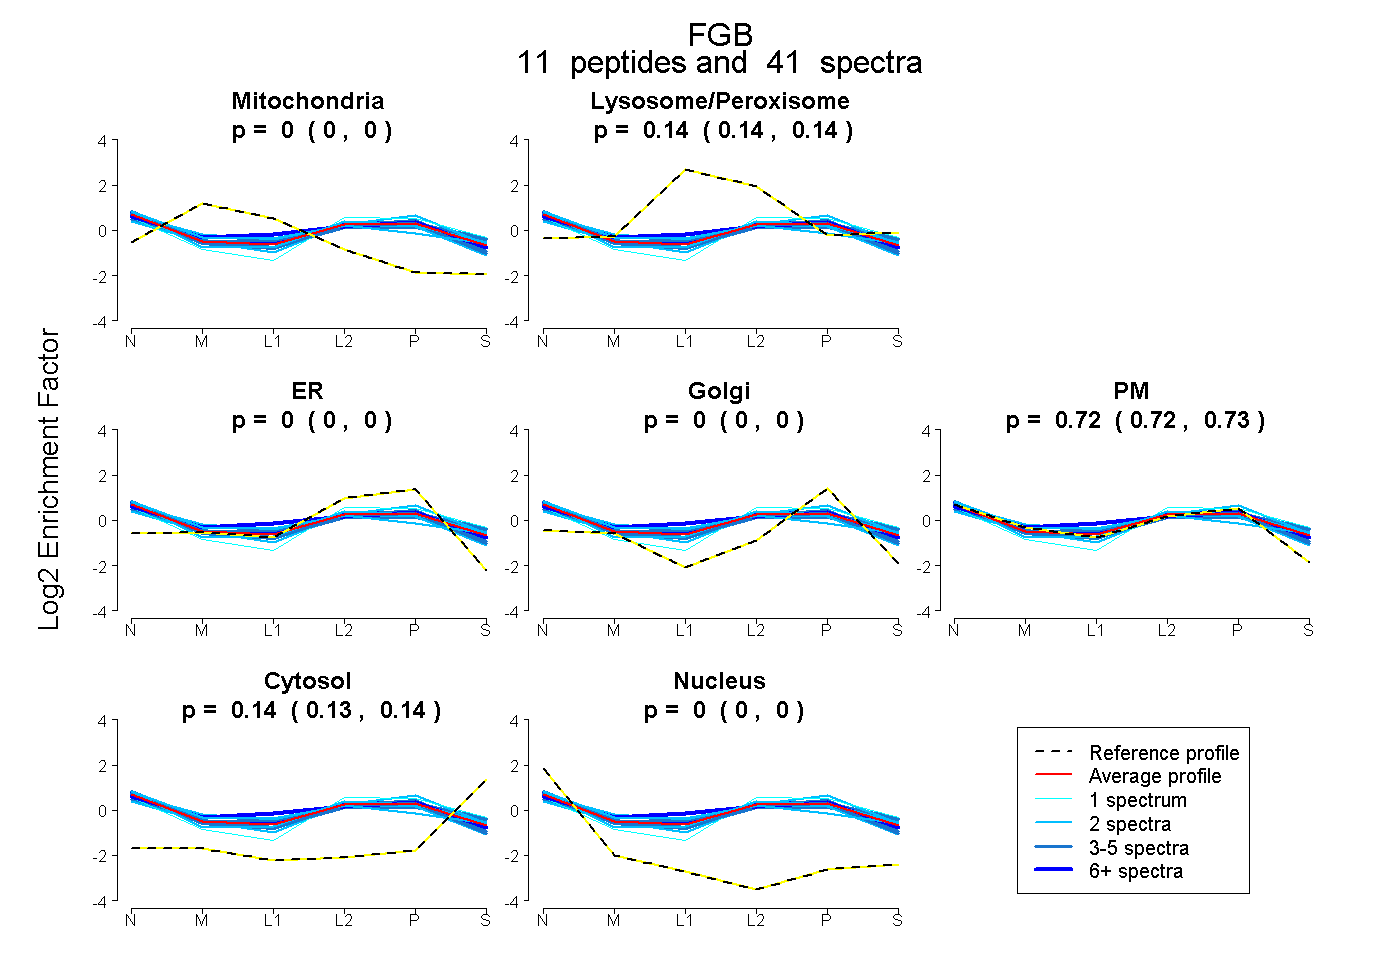
0.000 | 0.000
0.135 | 0.145
0.000 | 0.000
0.000 | 0.000
0.718 | 0.729
0.132 | 0.139
0.000 | 0.000
26peptides
spectra
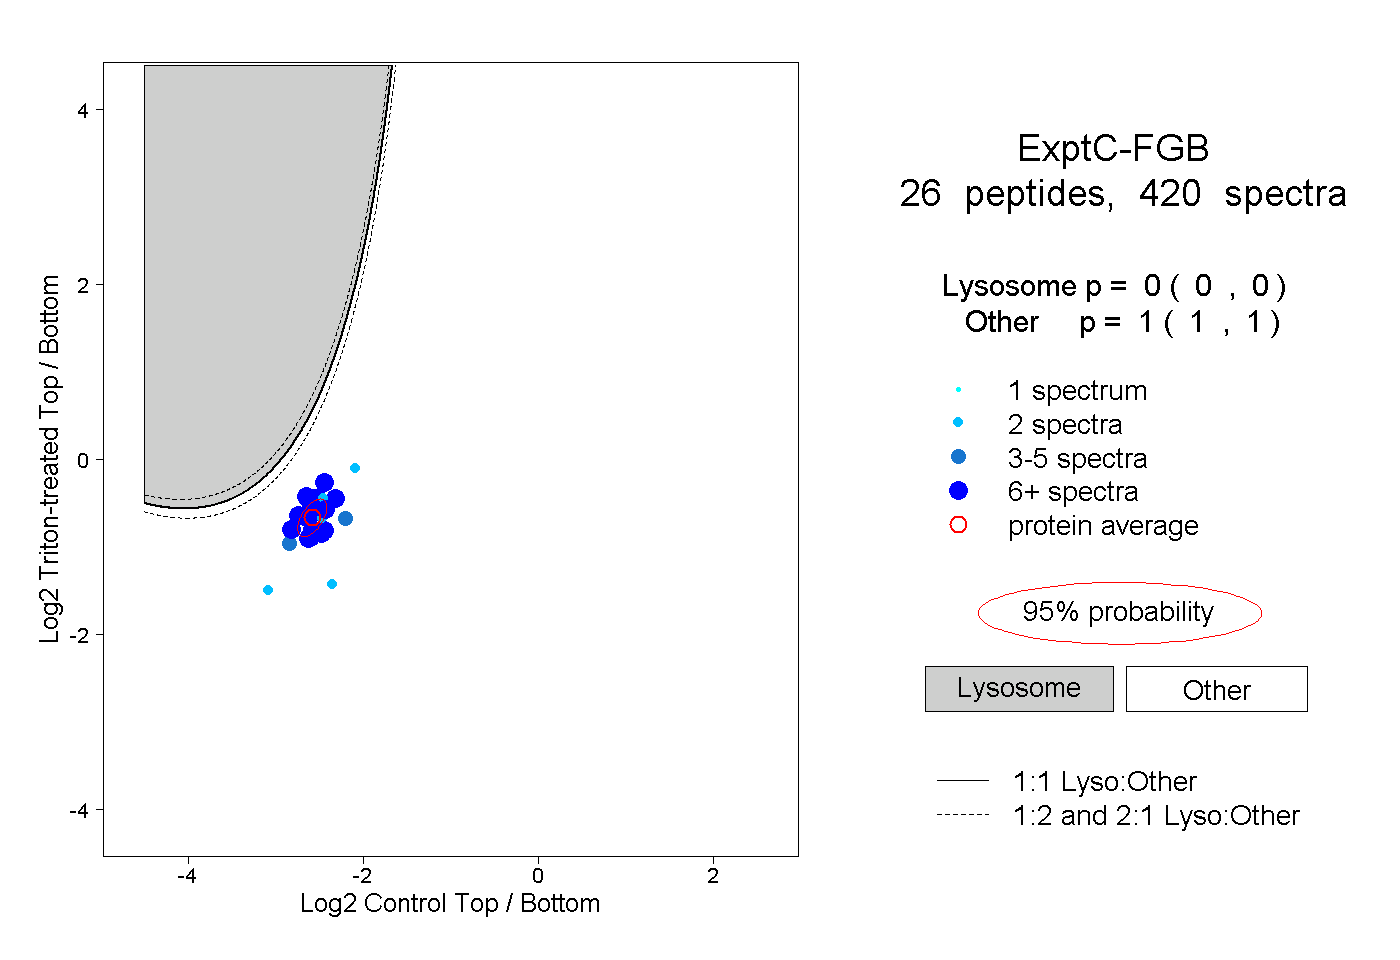
0.000 | 0.000
1.000 | 1.000
13peptides
spectra

0.000 | 0.001
0.999 | 1.000