| 4 spectra, SLLEDIR |
0.000 |
|
0.080 |
|
0.000 |
0.000 |
0.823 |
0.097 |
0.000 |
|
| 9 spectra, QTLLNHERPIK |
0.000 |
|
0.214 |
|
0.000 |
0.000 |
0.684 |
0.101 |
0.000 |
|
| 2 spectra, ISQLTR |
0.000 |
|
0.158 |
|
0.000 |
0.000 |
0.758 |
0.074 |
0.010 |
|
| 2 spectra, YCGLPGEYWLGNDK |
0.000 |
|
0.143 |
|
0.000 |
0.000 |
0.708 |
0.149 |
0.000 |
|
| 2 spectra, TENGGWTVIQNR |
0.000 |
|
0.244 |
|
0.000 |
0.000 |
0.580 |
0.117 |
0.059 |
|
| 4 spectra, QDGSVDFGR |
0.000 |
|
0.081 |
|
0.000 |
0.000 |
0.810 |
0.109 |
0.000 |
|
| 7 spectra, ECEEIIR |
0.000 |
|
0.146 |
|
0.000 |
0.000 |
0.741 |
0.113 |
0.000 |
|
| 4 spectra, EEPPSLRPAPPPISGGGYR |
0.000 |
|
0.203 |
|
0.000 |
0.000 |
0.616 |
0.181 |
0.000 |
|
| 1 spectrum, IGPTELLIEMEDWK |
0.000 |
|
0.072 |
|
0.093 |
0.000 |
0.637 |
0.199 |
0.000 |
|
| 2 spectra, GHRPVDR |
0.000 |
|
0.139 |
|
0.000 |
0.155 |
0.574 |
0.131 |
0.000 |
|
| 4 spectra, EDGGGWWYNR |
0.000 |
|
0.136 |
|
0.000 |
0.000 |
0.673 |
0.191 |
0.000 |
|
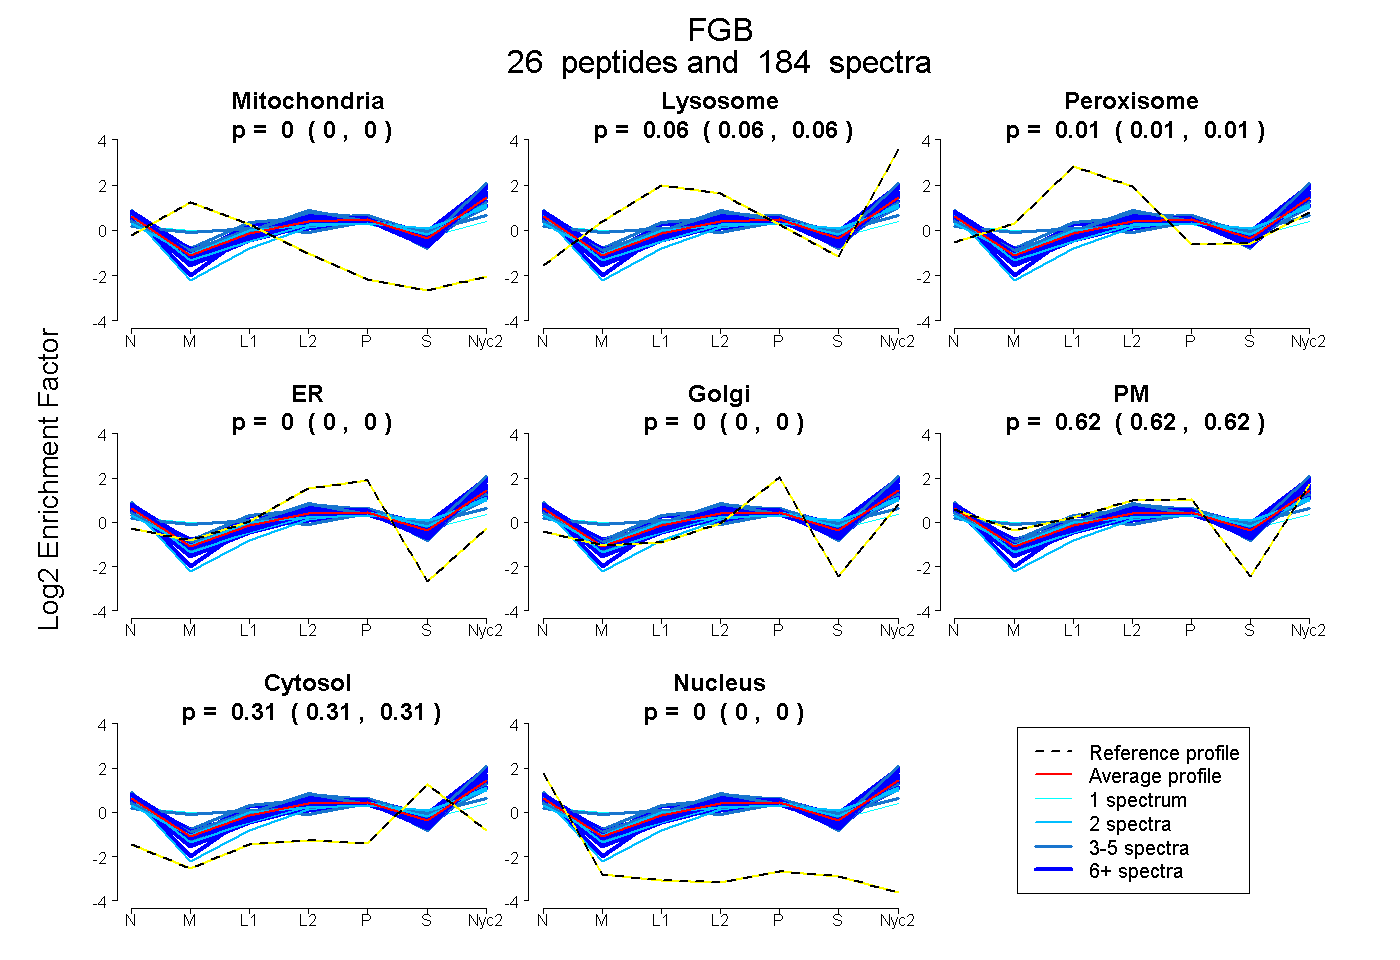
 26
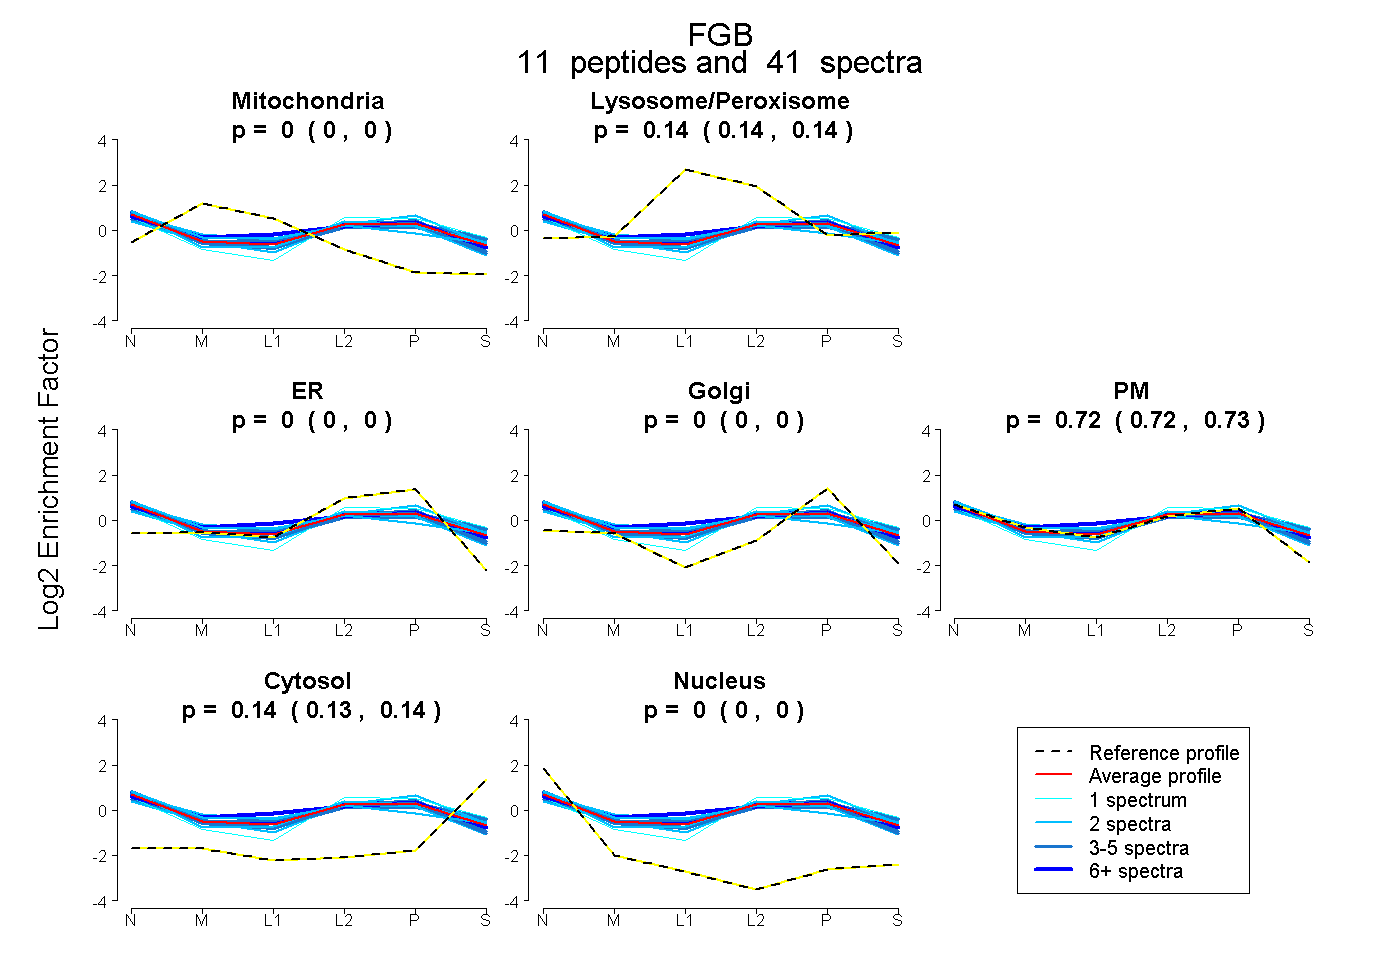
26