 42
42peptides
spectra
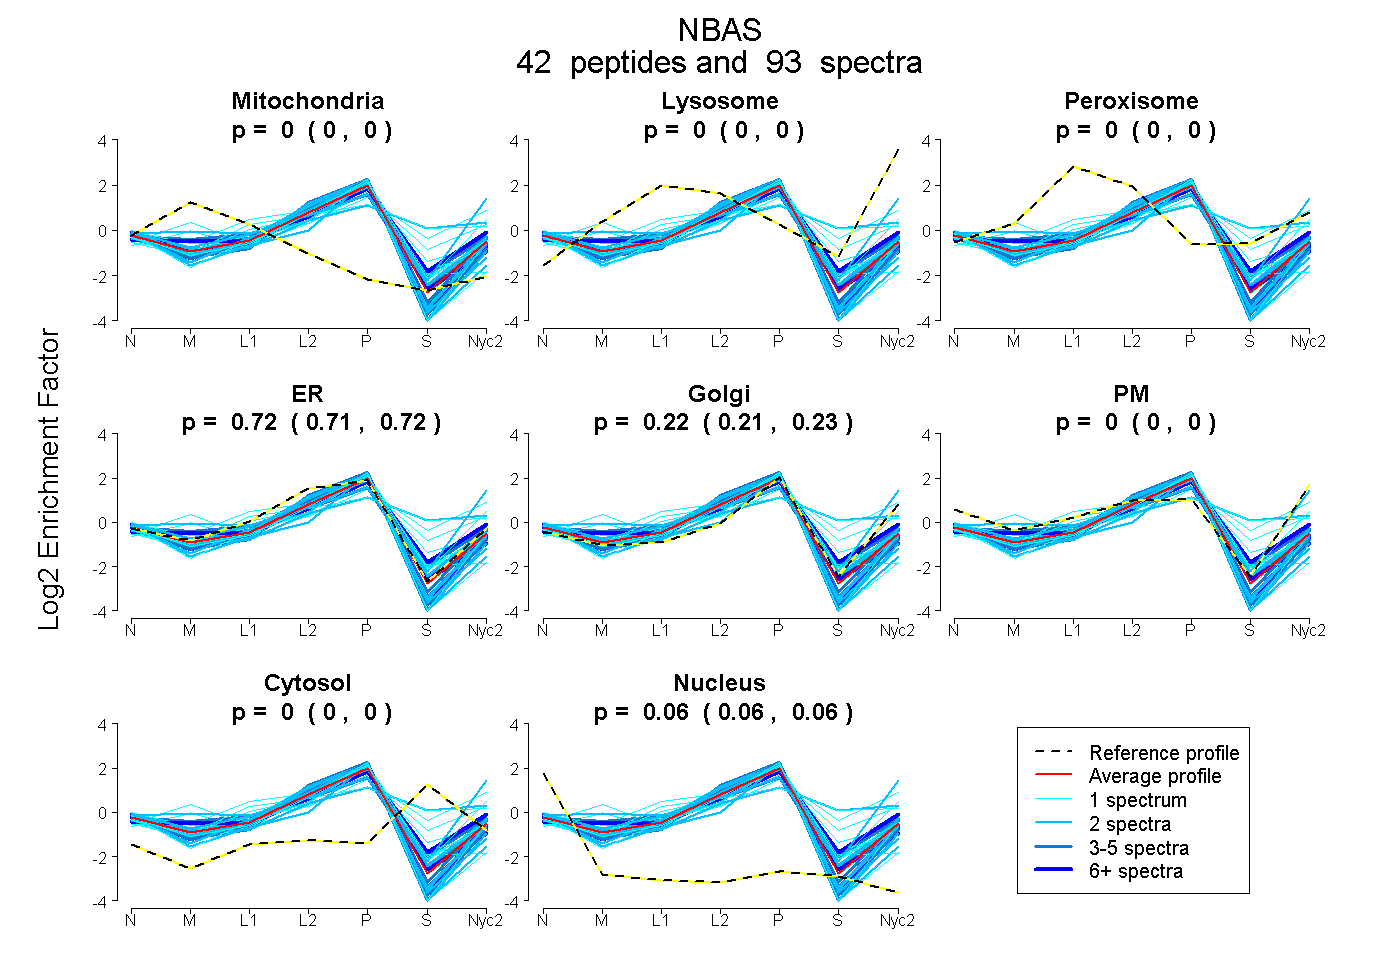
0.000 | 0.000
0.000 | 0.000
0.000 | 0.000
0.712 | 0.723
0.213 | 0.225
0.000 | 0.000
0.000 | 0.000
0.061 | 0.064
14peptides
spectra
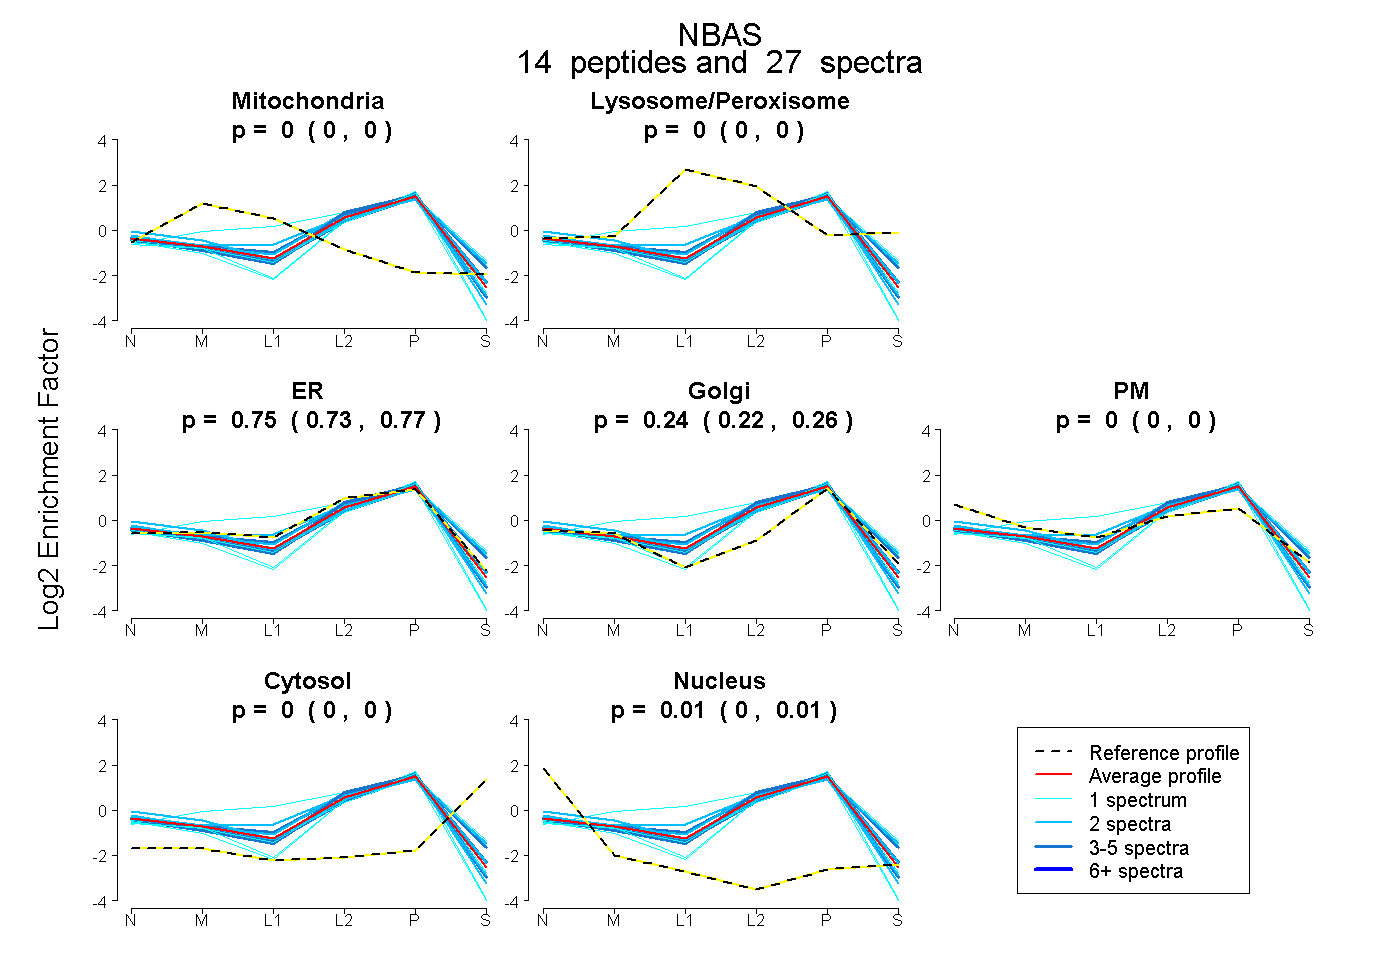
0.000 | 0.000
0.000 | 0.000
0.732 | 0.765
0.220 | 0.260
0.000 | 0.000
0.000 | 0.000
0.005 | 0.012
34peptides
spectra
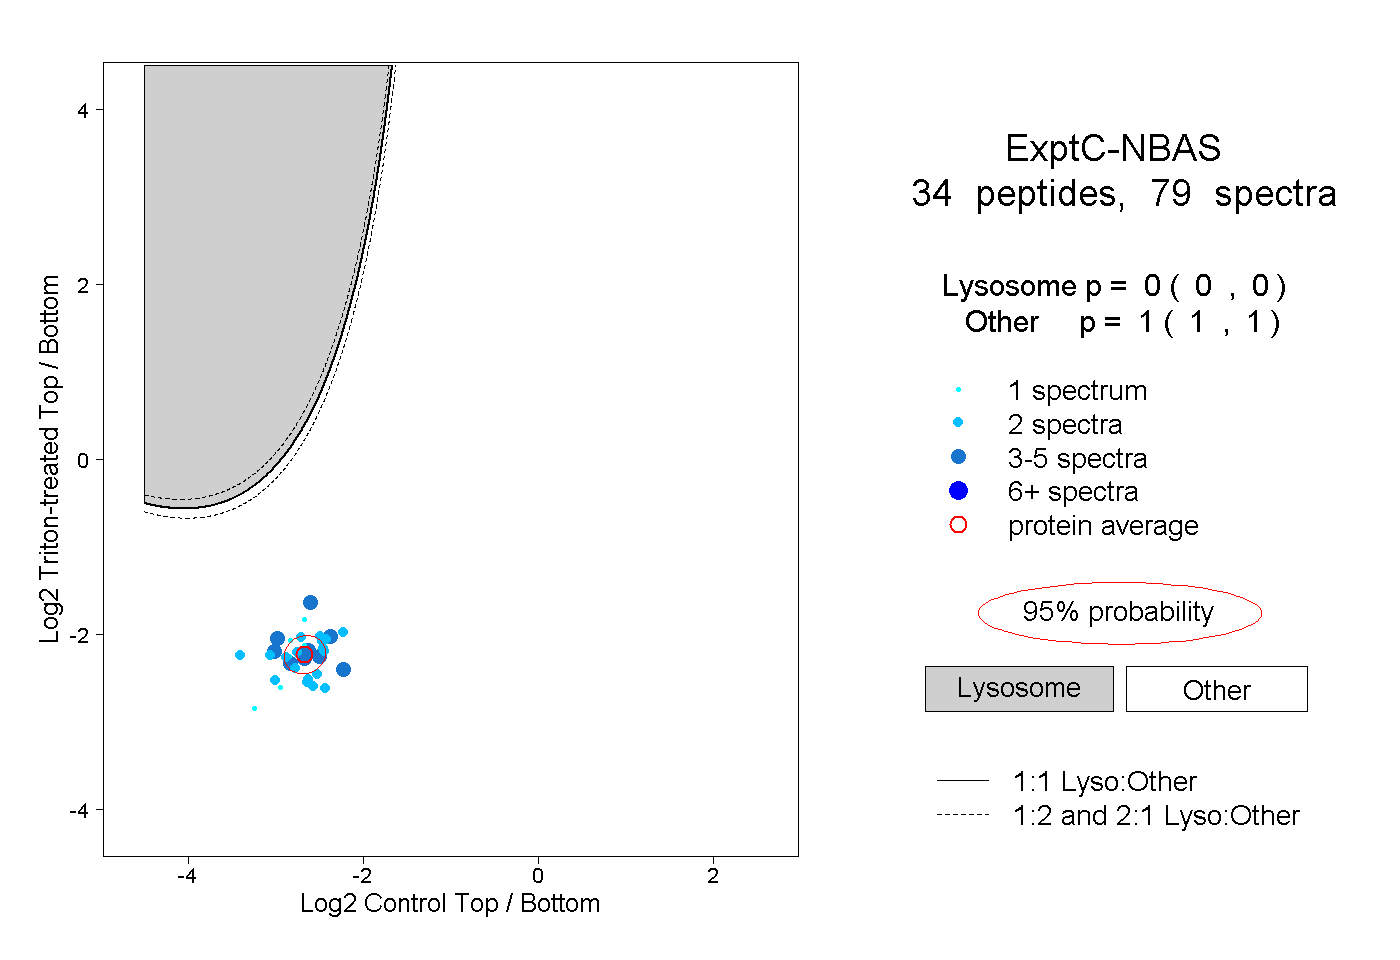
0.000 | 0.000
1.000 | 1.000
7peptides
spectra
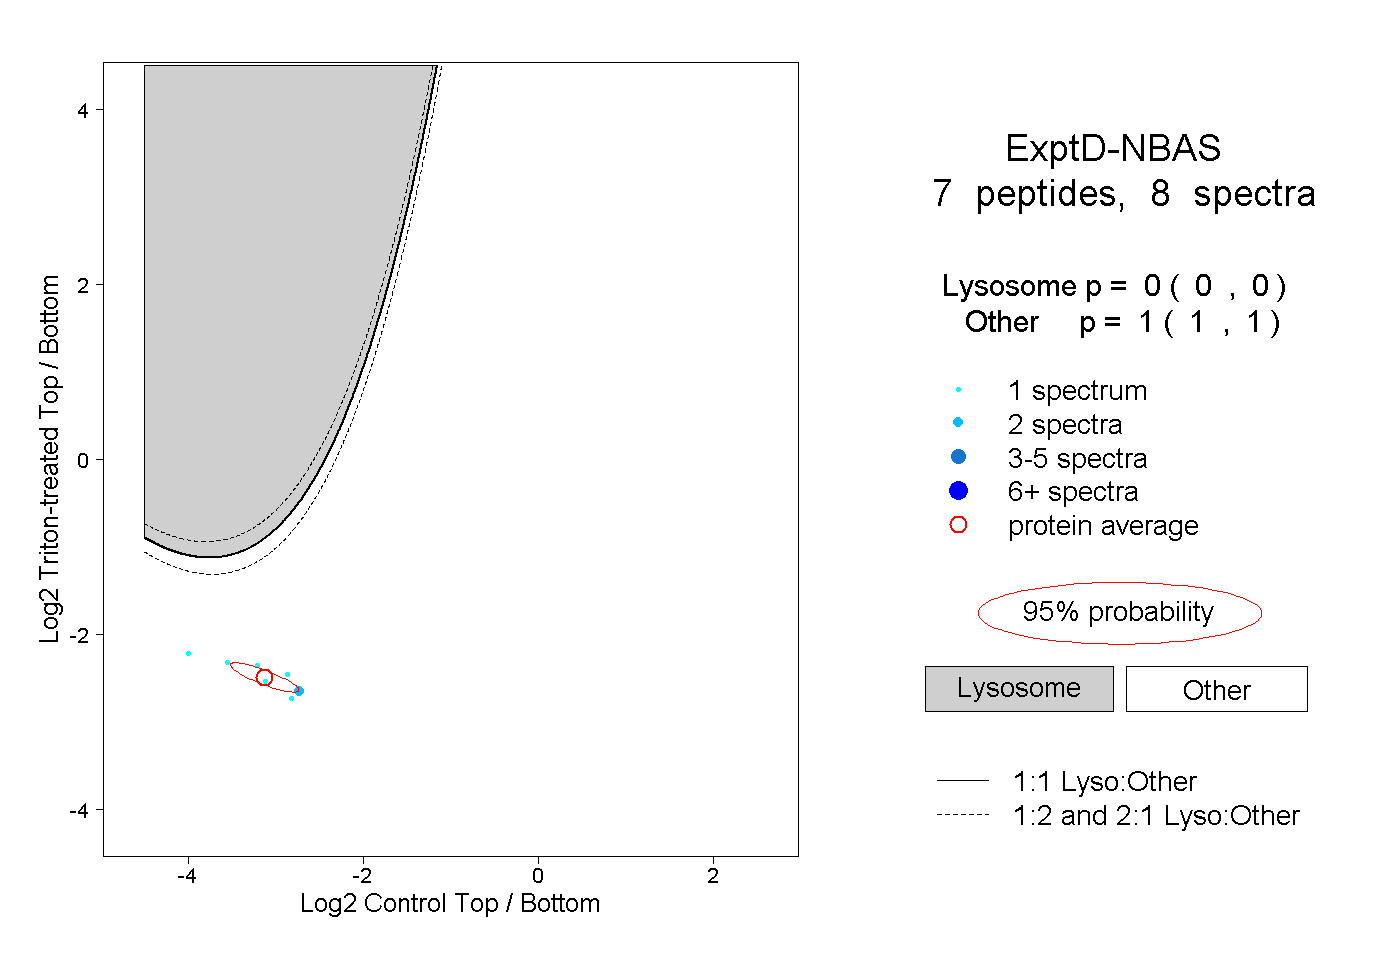
0.000 | 0.000
1.000 | 1.000