 15
15peptides
spectra
0.045 | 0.047
0.000 | 0.000
0.858 | 0.861
0.012 | 0.014
0.000 | 0.000
0.000 | 0.000
0.081 | 0.082
0.000 | 0.000
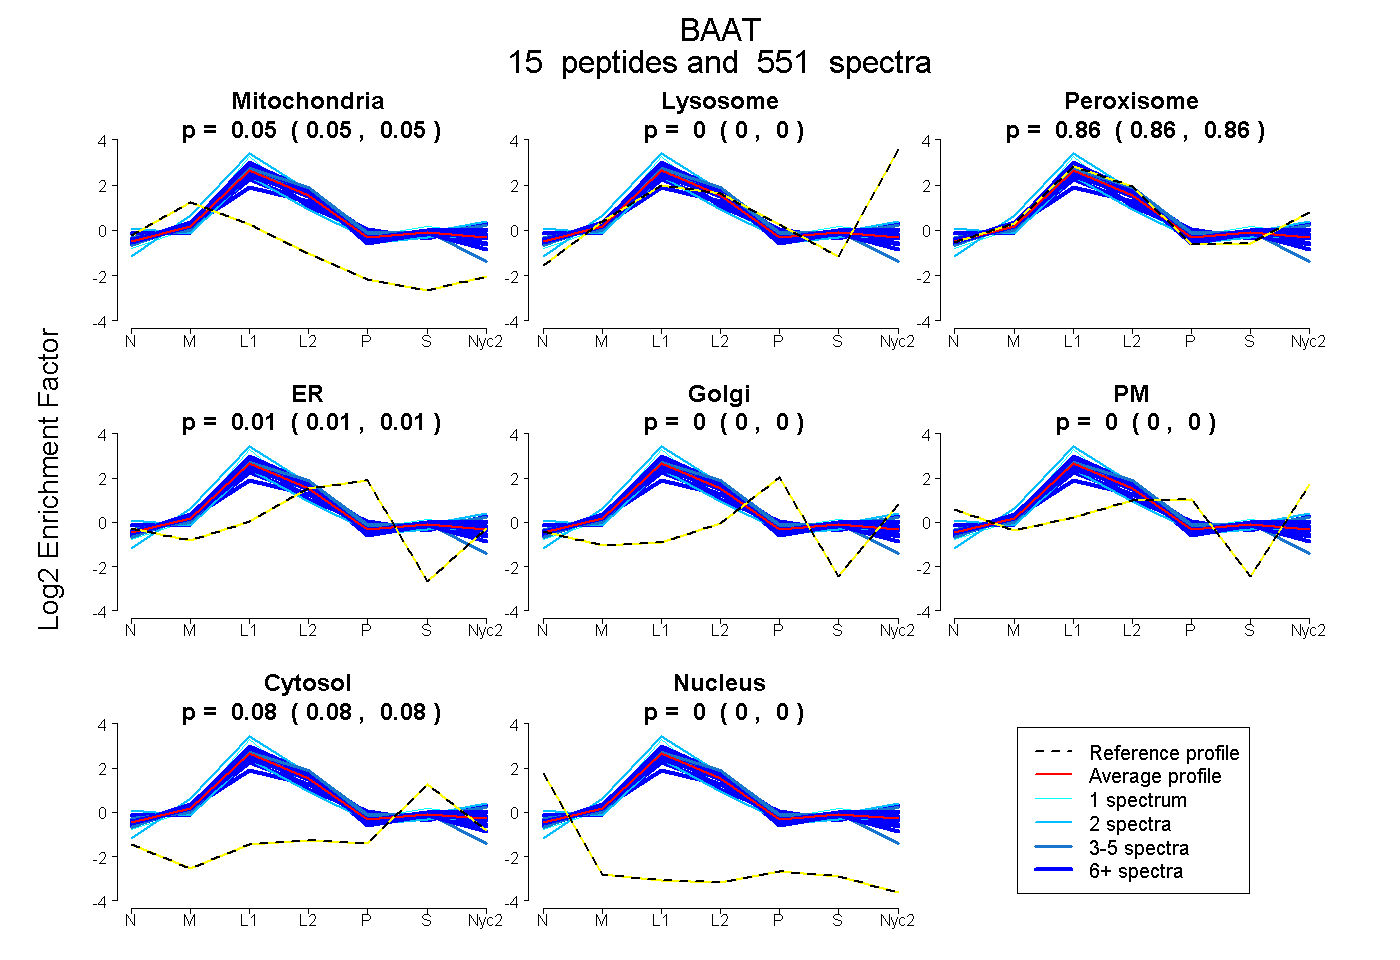
| Plot | Mito | Lyso | Perox | ER | Golgi | PM | Cytosol | Nucleus | |||||
| Expt A |
15 peptides |
551 spectra |
|
0.046 0.045 | 0.047 |
0.000 0.000 | 0.000 |
0.859 0.858 | 0.861 |
0.013 0.012 | 0.014 |
0.000 0.000 | 0.000 |
0.000 0.000 | 0.000 |
0.081 0.081 | 0.082 |
0.000 0.000 | 0.000 |
| 4 spectra, TFEETADK | 0.000 | 0.000 | 0.903 | 0.050 | 0.000 | 0.000 | 0.047 | 0.000 | ||
| 45 spectra, LCHPYFPVEGK | 0.083 | 0.000 | 0.723 | 0.079 | 0.000 | 0.000 | 0.116 | 0.000 | ||
| 46 spectra, QAIAQLMK | 0.076 | 0.000 | 0.838 | 0.000 | 0.000 | 0.000 | 0.086 | 0.000 | ||
| 2 spectra, NWTLLSYPGAGHLIEPPYSPLCSASR | 0.052 | 0.000 | 0.948 | 0.000 | 0.000 | 0.000 | 0.000 | 0.000 | ||
| 4 spectra, VTGLTPFQVVCLQASLK | 0.042 | 0.000 | 0.833 | 0.041 | 0.000 | 0.000 | 0.037 | 0.046 | ||
| 41 spectra, YCFPIEK | 0.108 | 0.000 | 0.783 | 0.026 | 0.000 | 0.000 | 0.083 | 0.000 | ||
| 13 spectra, LTAVPLSALVDEPVHIR | 0.016 | 0.000 | 0.731 | 0.092 | 0.064 | 0.000 | 0.098 | 0.000 | ||
| 165 spectra, ASEVGEVDLER | 0.039 | 0.000 | 0.906 | 0.000 | 0.000 | 0.000 | 0.055 | 0.000 | ||
| 1 spectrum, DSSLGGDYMGVHPMGLFWSMKPEK | 0.000 | 0.000 | 0.904 | 0.000 | 0.000 | 0.000 | 0.096 | 0.000 | ||
| 61 spectra, DVMNRPHK | 0.020 | 0.000 | 0.846 | 0.073 | 0.000 | 0.000 | 0.061 | 0.000 | ||
| 24 spectra, QHLNPGFNSQL | 0.000 | 0.000 | 0.900 | 0.003 | 0.000 | 0.000 | 0.046 | 0.051 | ||
| 65 spectra, VISSSLDSLILER | 0.052 | 0.000 | 0.902 | 0.000 | 0.000 | 0.000 | 0.046 | 0.000 | ||
| 29 spectra, GNLFNSQAFYR | 0.000 | 0.000 | 0.945 | 0.000 | 0.000 | 0.000 | 0.055 | 0.000 | ||
| 2 spectra, QITATVLINGPNFVSSNPHVYR | 0.000 | 0.000 | 0.836 | 0.000 | 0.000 | 0.016 | 0.106 | 0.041 | ||
| 49 spectra, WYVAPGVTR | 0.013 | 0.000 | 0.864 | 0.006 | 0.000 | 0.000 | 0.117 | 0.000 |
| Plot | Mito | Lyso or Perox | ER | Golgi | PM | Cytosol | Nucleus | ||||||
| Expt B |
16 peptides |
255 spectra |
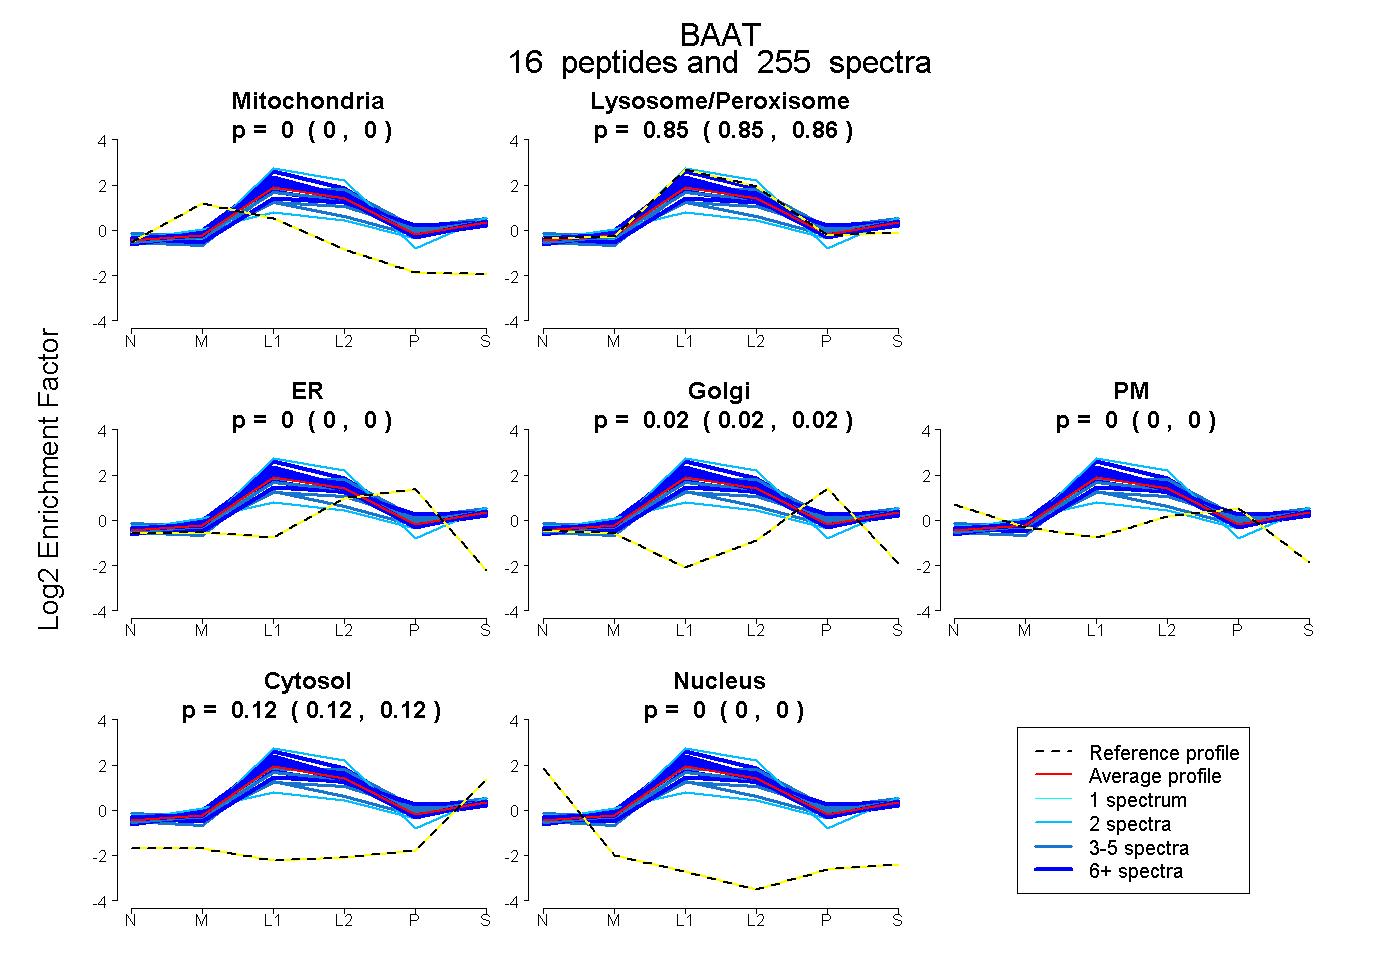 |
0.000 0.000 | 0.000 |
0.855 0.852 | 0.857 |
0.000 0.000 | 0.000 |
0.023 0.021 | 0.024 |
0.000 0.000 | 0.000 |
0.123 0.121 | 0.124 |
0.000 0.000 | 0.000 |
|||
| Plot | Lyso | Other | |||||||||||
| Expt C |
18 peptides |
1735 spectra |
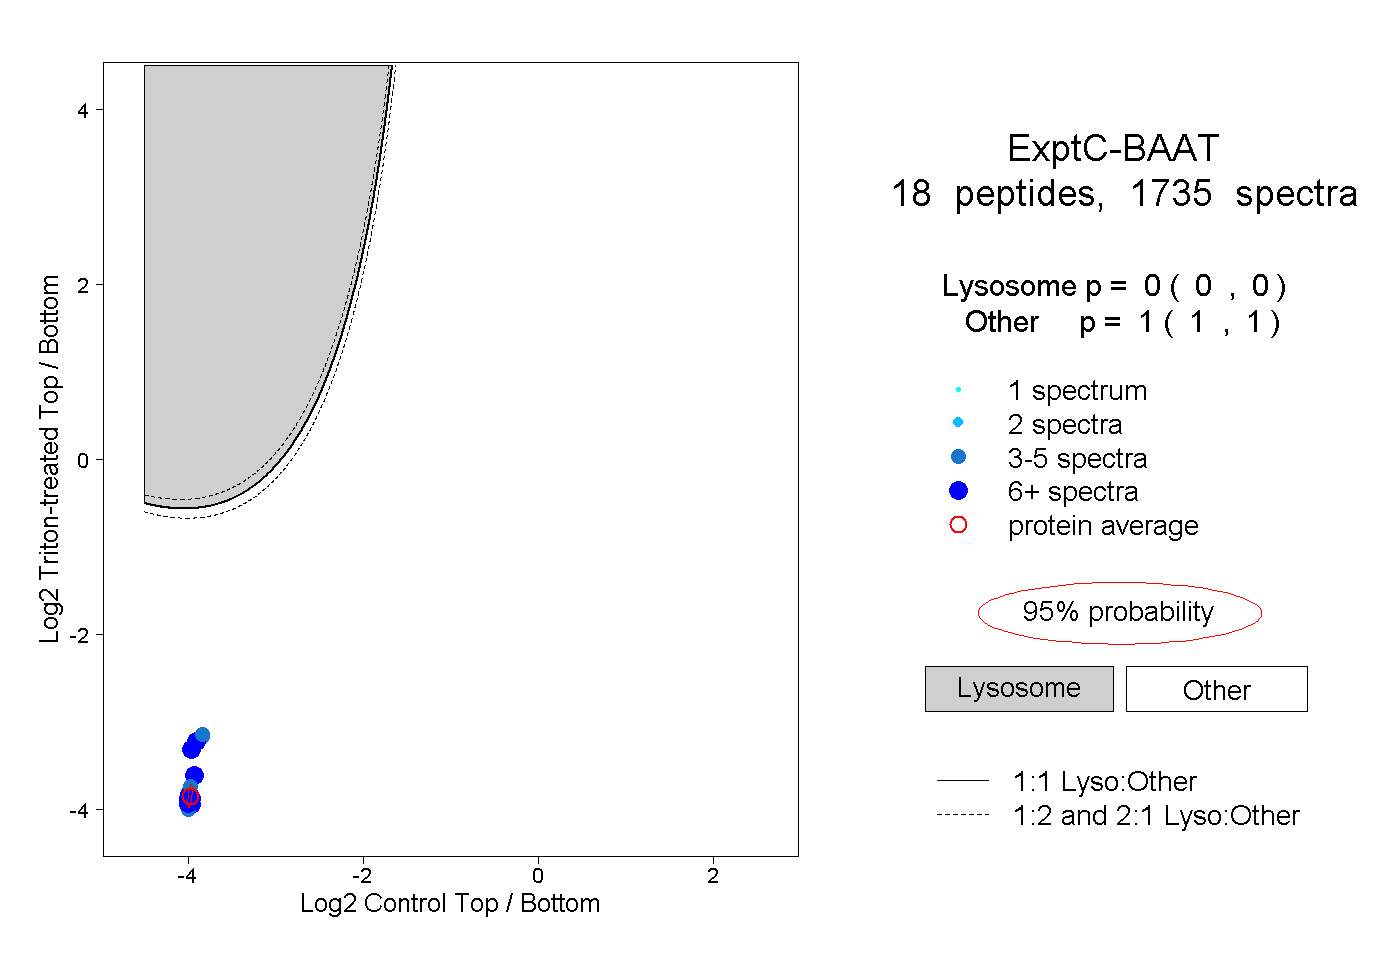 |
0.000 0.000 | 0.000 |
1.000 1.000 | 1.000 |
||||||||
| Plot | Lyso | Other | |||||||||||
| Expt D |
11 peptides |
207 spectra |
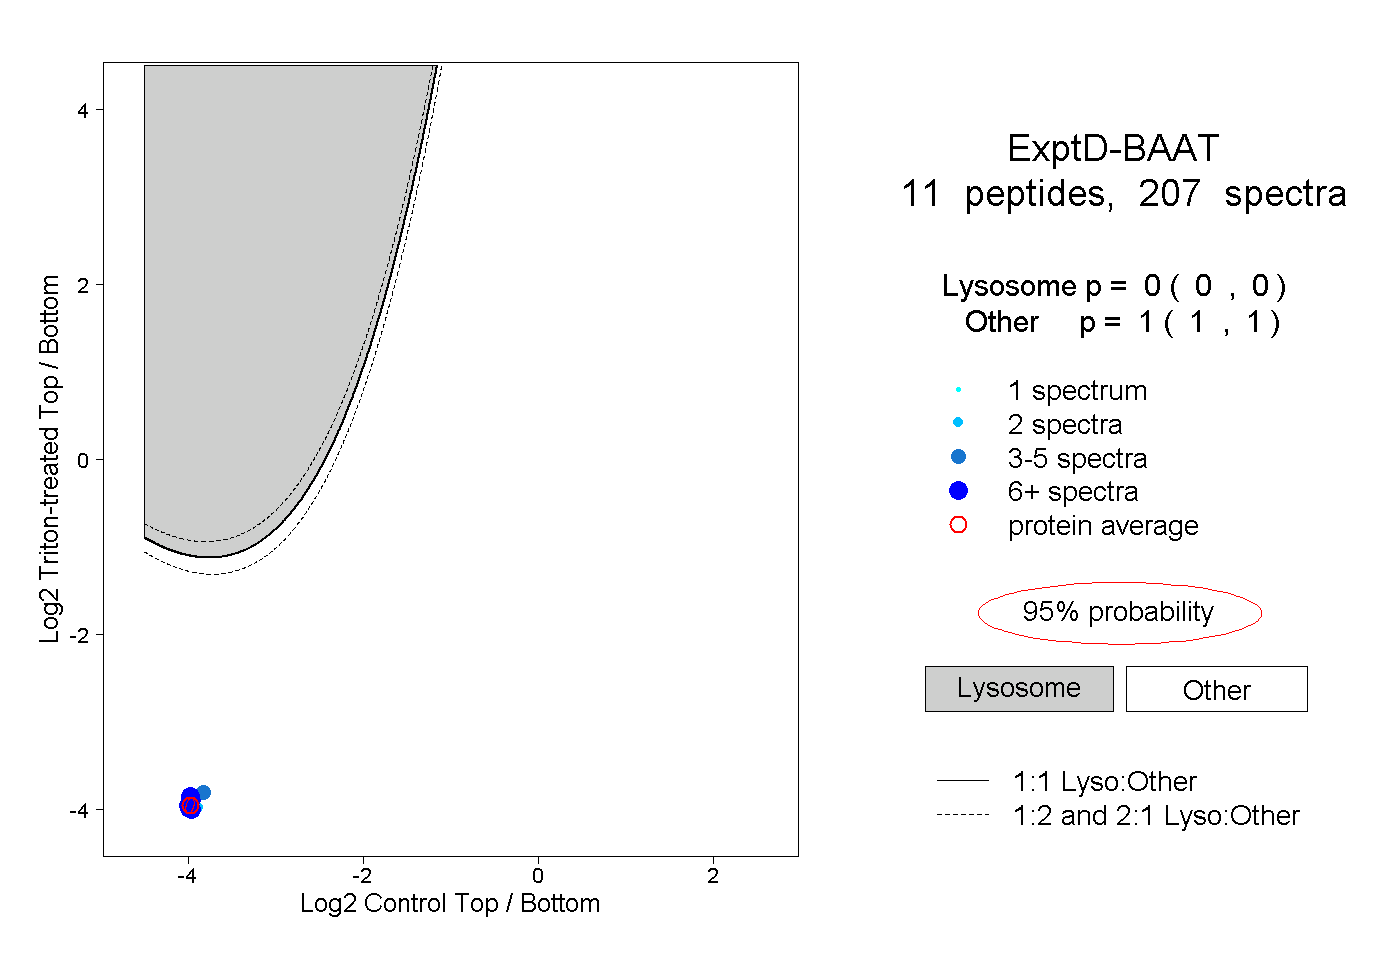 |
0.000 0.000 | 0.000 |
1.000 1.000 | 1.000 |