 12
12peptides
spectra
0.158 | 0.199
0.000 | 0.000
0.000 | 0.026
0.079 | 0.099
0.000 | 0.000
0.000 | 0.000
0.665 | 0.678
0.034 | 0.056
6peptides
spectra
0.000 | 0.002
0.998 | 1.000
| Plot | Mito | Lyso | Perox | ER | Golgi | PM | Cytosol | Nucleus | |||||
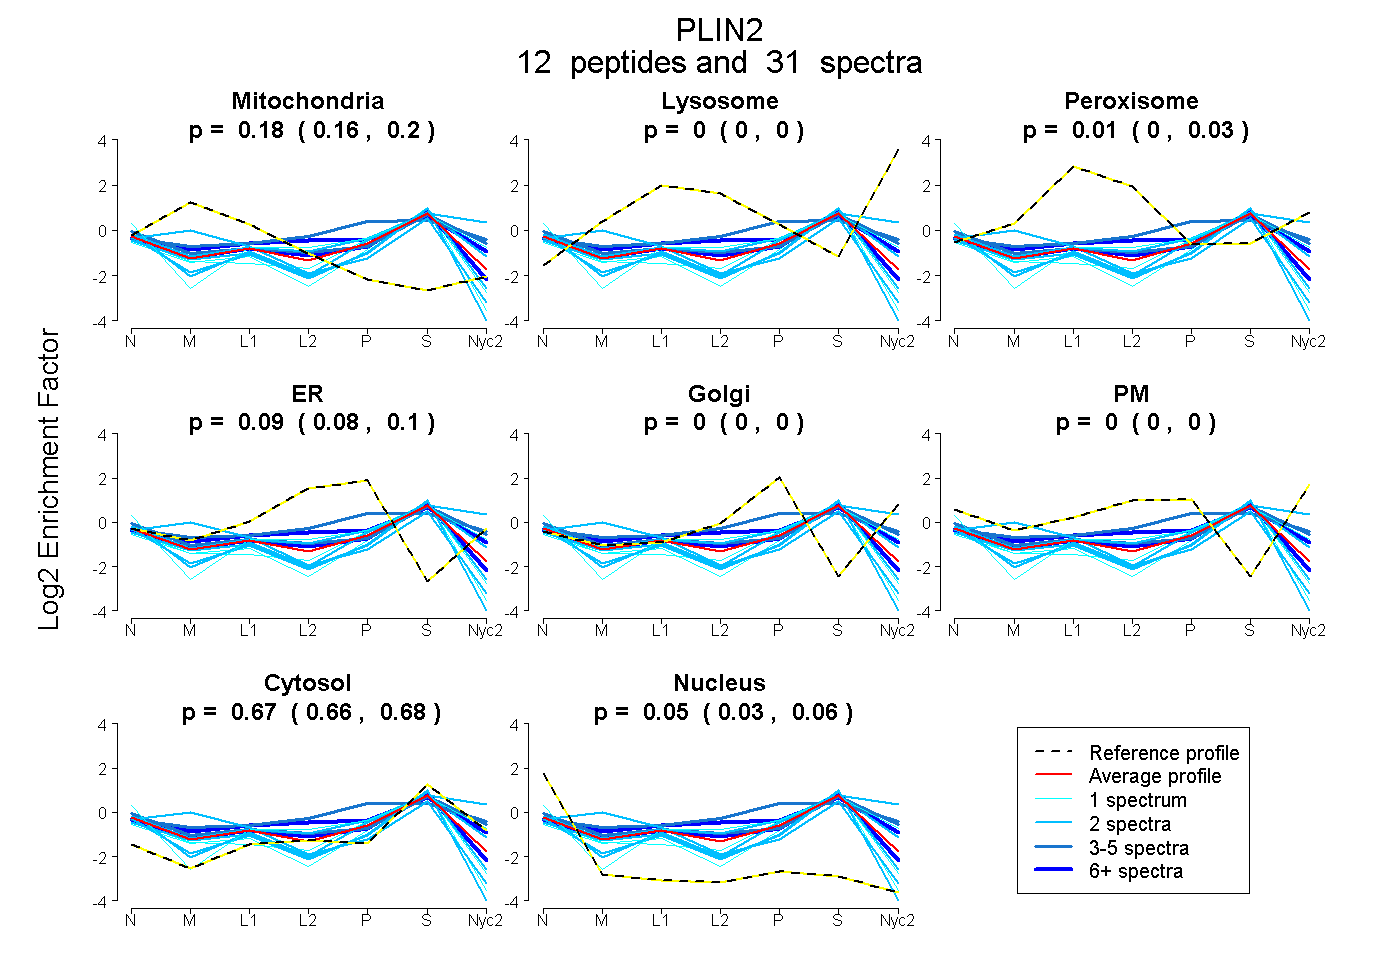
| Expt A |
12 peptides |
31 spectra |
|
0.182 0.158 | 0.199 |
0.000 0.000 | 0.000 |
0.009 0.000 | 0.026 |
0.090 0.079 | 0.099 |
0.000 0.000 | 0.000 |
0.000 0.000 | 0.000 |
0.673 0.665 | 0.678 |
0.045 0.034 | 0.056 |
||
| Plot | Lyso | Other | |||||||||||
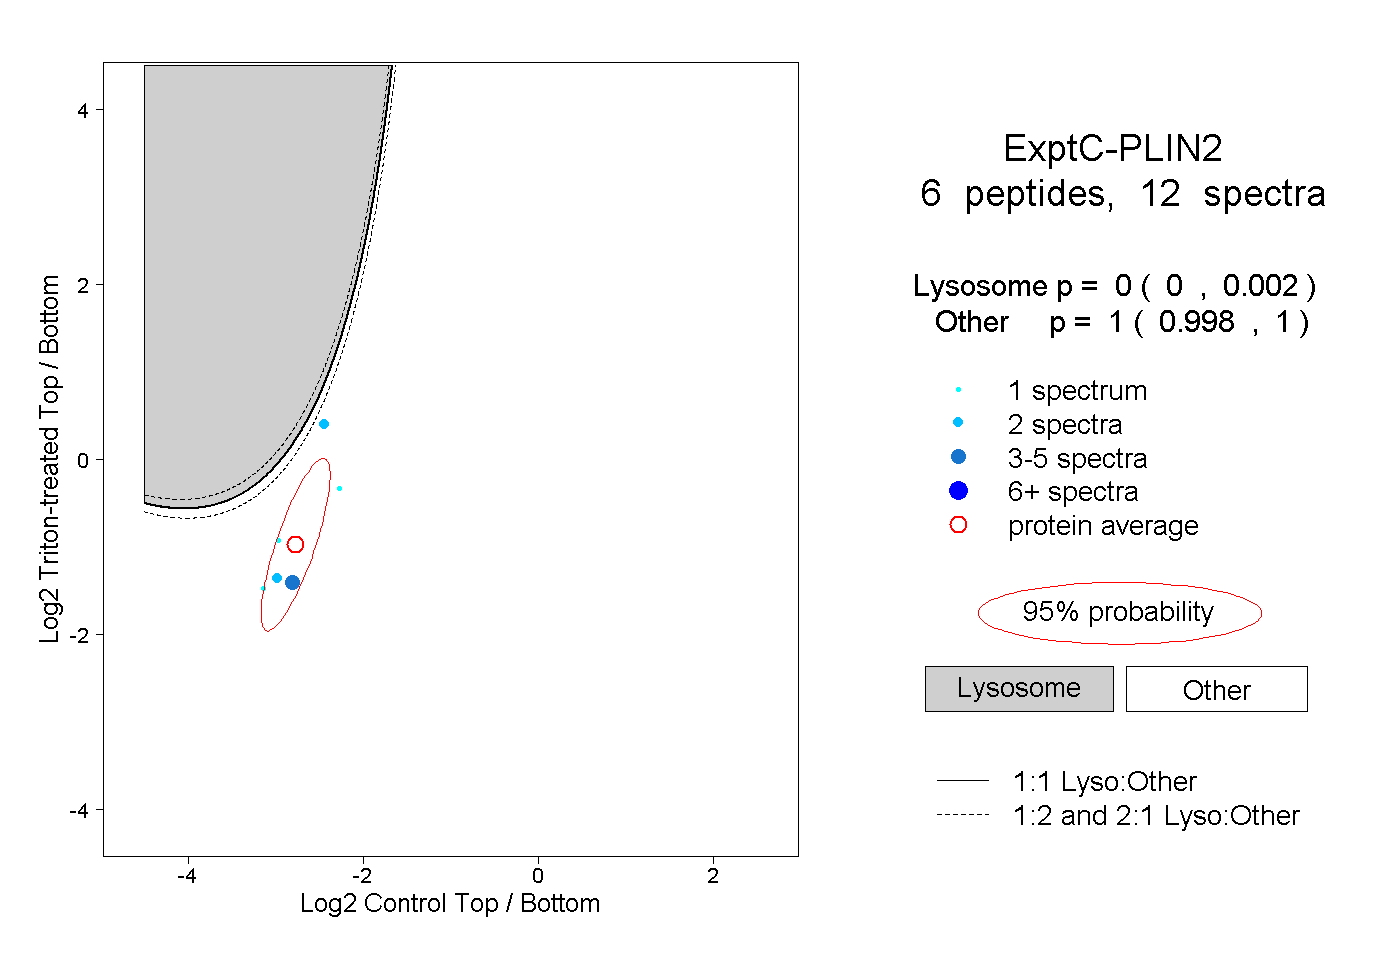
| Expt C |
6 peptides |
12 spectra |
|
0.000 0.000 | 0.002 |
1.000 0.998 | 1.000 |