 3
3peptides
spectra
0.000 | 0.098
0.000 | 0.000
0.000 | 0.013
0.233 | 0.439
0.193 | 0.389
0.000 | 0.000
0.223 | 0.335
0.000 | 0.072
1peptide
spectra
NA | NA
NA | NA
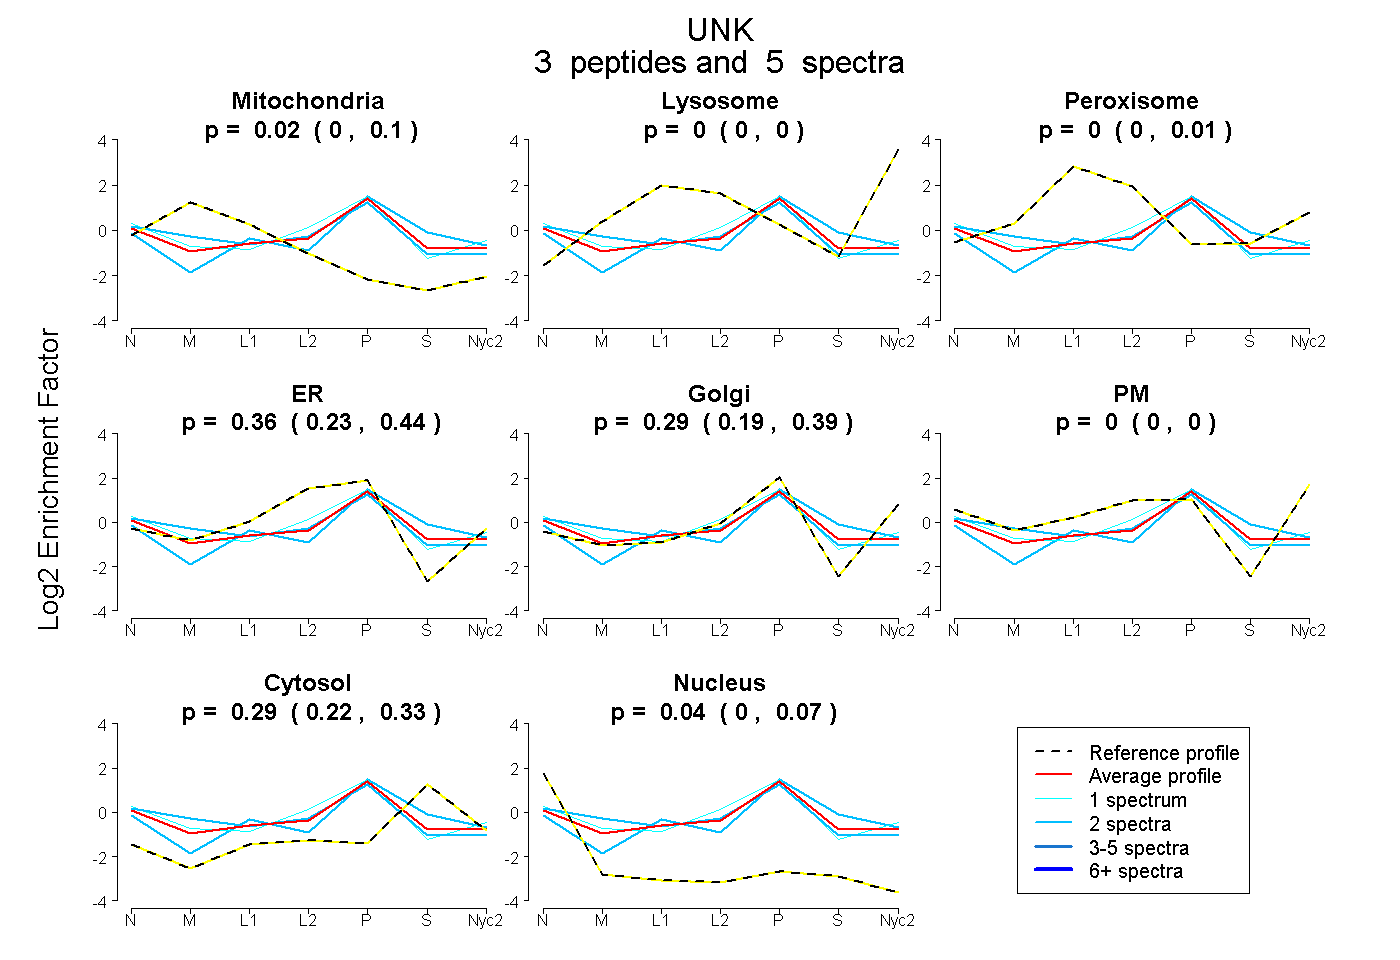
| Plot | Mito | Lyso | Perox | ER | Golgi | PM | Cytosol | Nucleus | |||||
| Expt A |
3 peptides |
5 spectra |
|
0.024 0.000 | 0.098 |
0.000 0.000 | 0.000 |
0.000 0.000 | 0.013 |
0.359 0.233 | 0.439 |
0.291 0.193 | 0.389 |
0.000 0.000 | 0.000 |
0.286 0.223 | 0.335 |
0.040 0.000 | 0.072 |
||
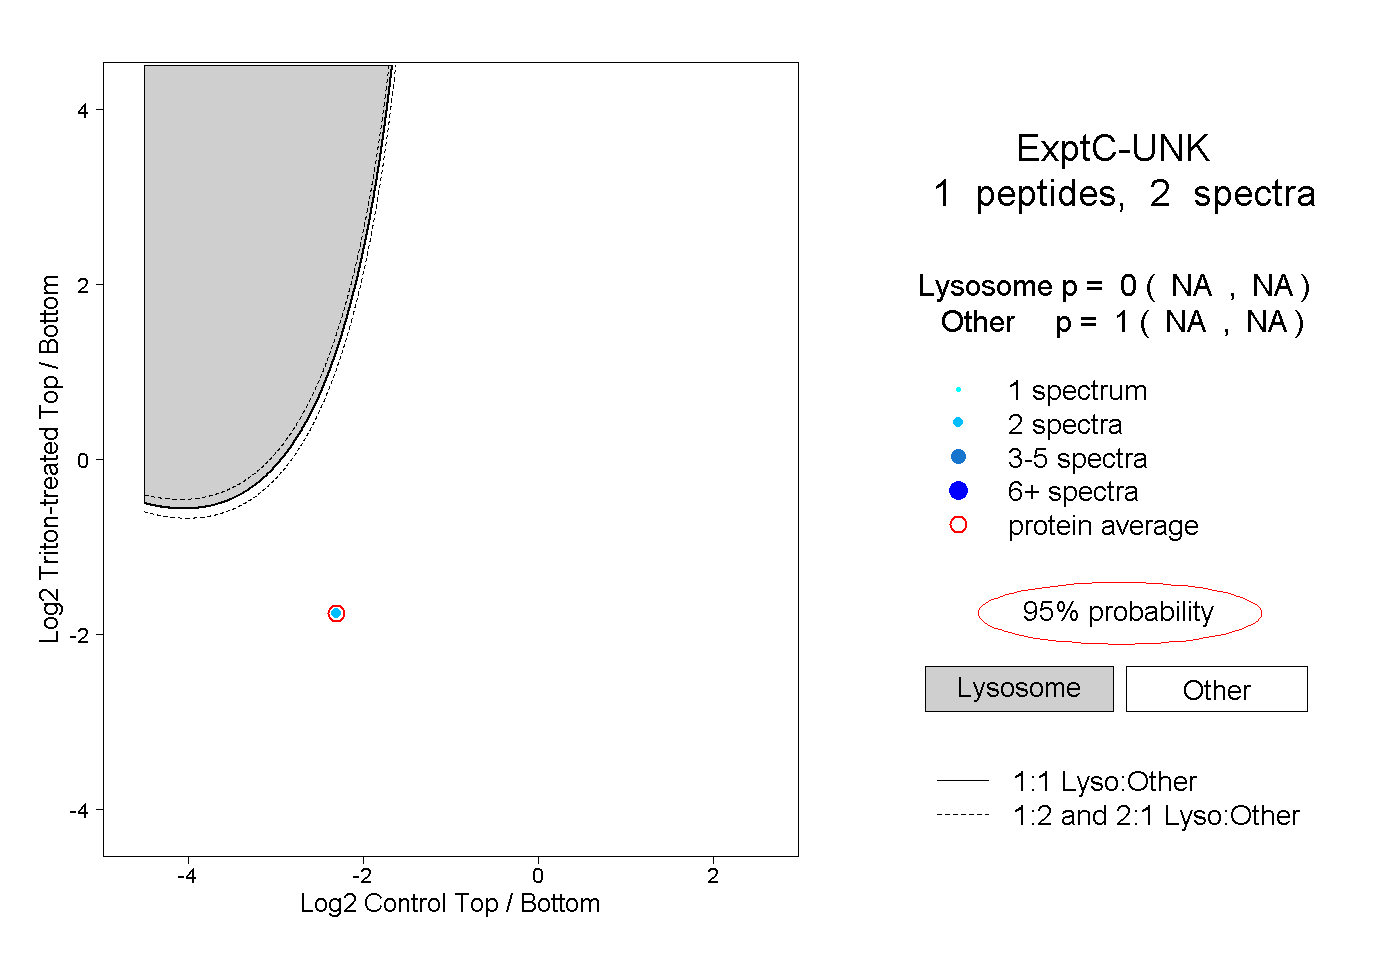
| Plot | Lyso | Other | |||||||||||
| Expt C |
1 peptide |
2 spectra |
|
0.000 NA | NA |
1.000 NA | NA |