 11
11peptides
spectra
0.000 | 0.000
0.000 | 0.000
0.058 | 0.088
0.114 | 0.167
0.000 | 0.000
0.579 | 0.632
0.124 | 0.188
0.000 | 0.029
| Plot | Mito | Lyso | Perox | ER | Golgi | PM | Cytosol | Nucleus | |||||
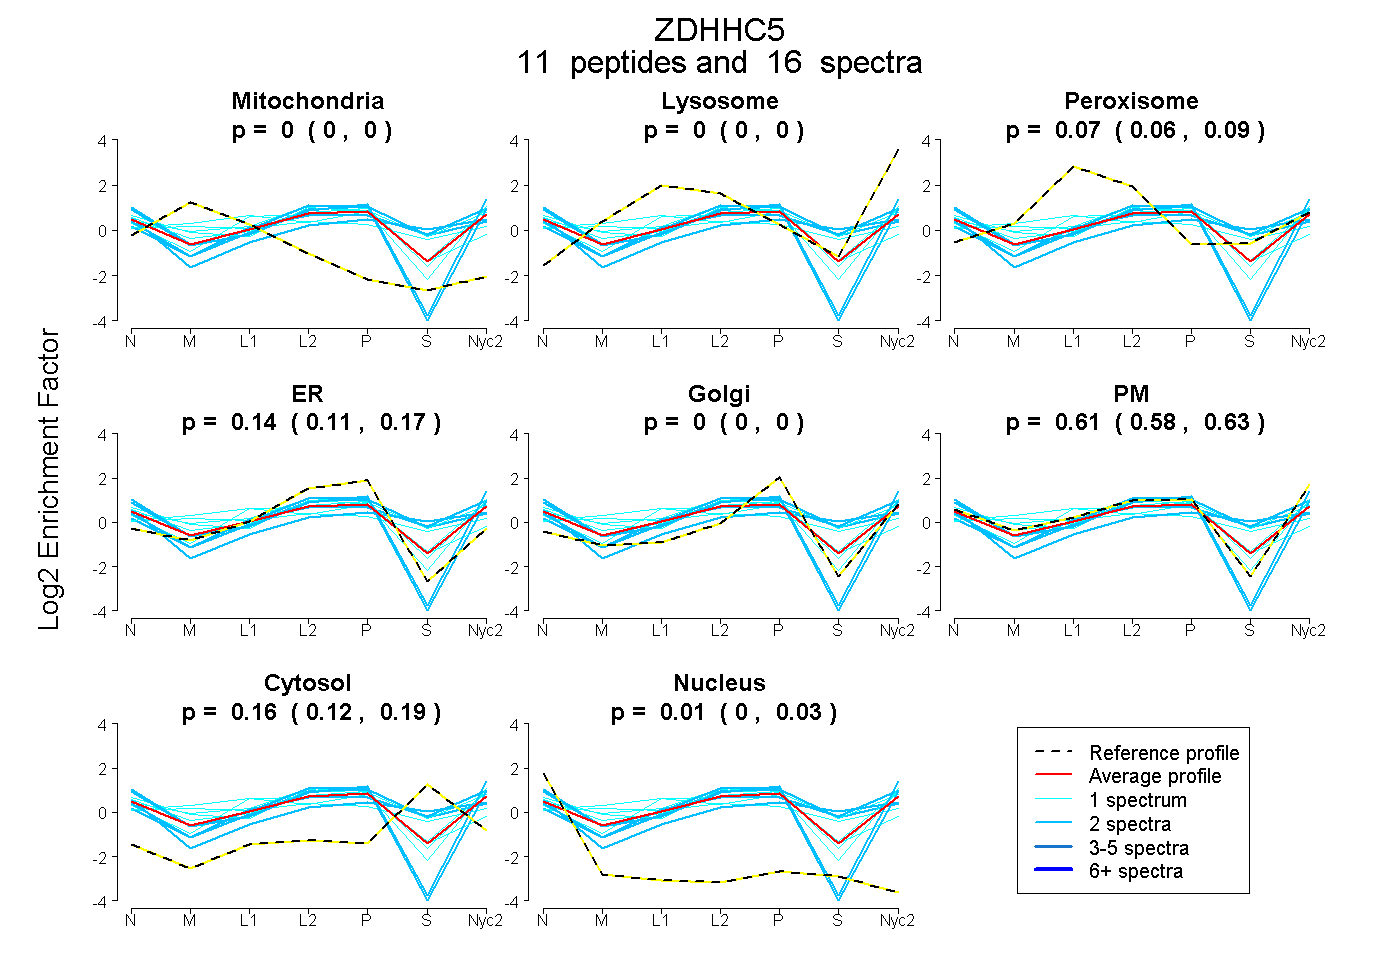
| Expt A |
11 peptides |
16 spectra |
|
0.000 0.000 | 0.000 |
0.000 0.000 | 0.000 |
0.075 0.058 | 0.088 |
0.143 0.114 | 0.167 |
0.000 0.000 | 0.000 |
0.608 0.579 | 0.632 |
0.160 0.124 | 0.188 |
0.013 0.000 | 0.029 |
| 2 spectra, VLCSSPAPR | 0.000 | 0.000 | 0.000 | 0.220 | 0.000 | 0.716 | 0.000 | 0.064 | ||
| 2 spectra, TPLGRPAVPR | 0.000 | 0.000 | 0.000 | 0.000 | 0.000 | 0.542 | 0.458 | 0.000 | ||
| 1 spectrum, WCATCR | 0.015 | 0.000 | 0.137 | 0.406 | 0.000 | 0.271 | 0.092 | 0.078 | ||
| 1 spectrum, DSPPTPTMYK | 0.106 | 0.000 | 0.266 | 0.000 | 0.116 | 0.281 | 0.231 | 0.000 | ||
| 2 spectra, SIGSASPGPGQPPLSSPTR | 0.000 | 0.000 | 0.147 | 0.000 | 0.000 | 0.548 | 0.305 | 0.000 | ||
| 1 spectrum, FGKPDGLR | 0.019 | 0.000 | 0.123 | 0.145 | 0.000 | 0.648 | 0.065 | 0.000 | ||
| 1 spectrum, SEGTTSTSYK | 0.101 | 0.050 | 0.260 | 0.000 | 0.286 | 0.285 | 0.018 | 0.000 | ||
| 1 spectrum, SEPSLEPESFR | 0.000 | 0.000 | 0.283 | 0.000 | 0.115 | 0.376 | 0.226 | 0.000 | ||
| 2 spectra, LLPTGPPHR | 0.000 | 0.000 | 0.119 | 0.266 | 0.000 | 0.317 | 0.299 | 0.000 | ||
| 1 spectrum, TTNEQVTGK | 0.062 | 0.000 | 0.000 | 0.091 | 0.000 | 0.811 | 0.015 | 0.022 | ||
| 2 spectra, YLGRPK | 0.000 | 0.000 | 0.000 | 0.086 | 0.000 | 0.859 | 0.000 | 0.055 |
| Plot | Lyso | Other | |||||||||||
| Expt C |
14 peptides |
31 spectra |
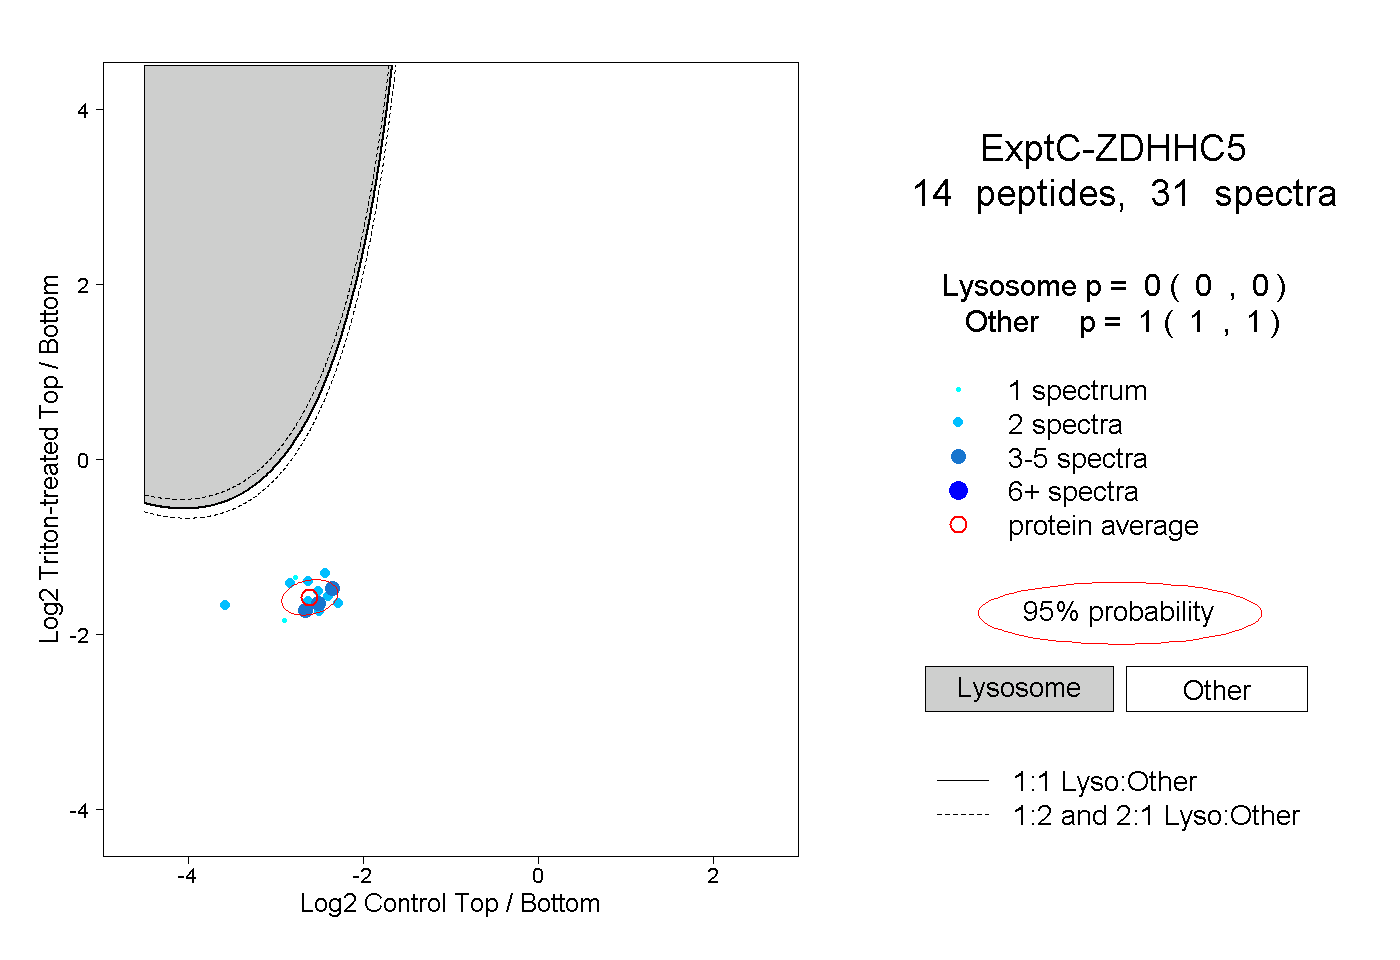 |
0.000 0.000 | 0.000 |
1.000 1.000 | 1.000 |
||||||||
| Plot | Lyso | Other | |||||||||||
| Expt D |
1 peptide |
2 spectra |
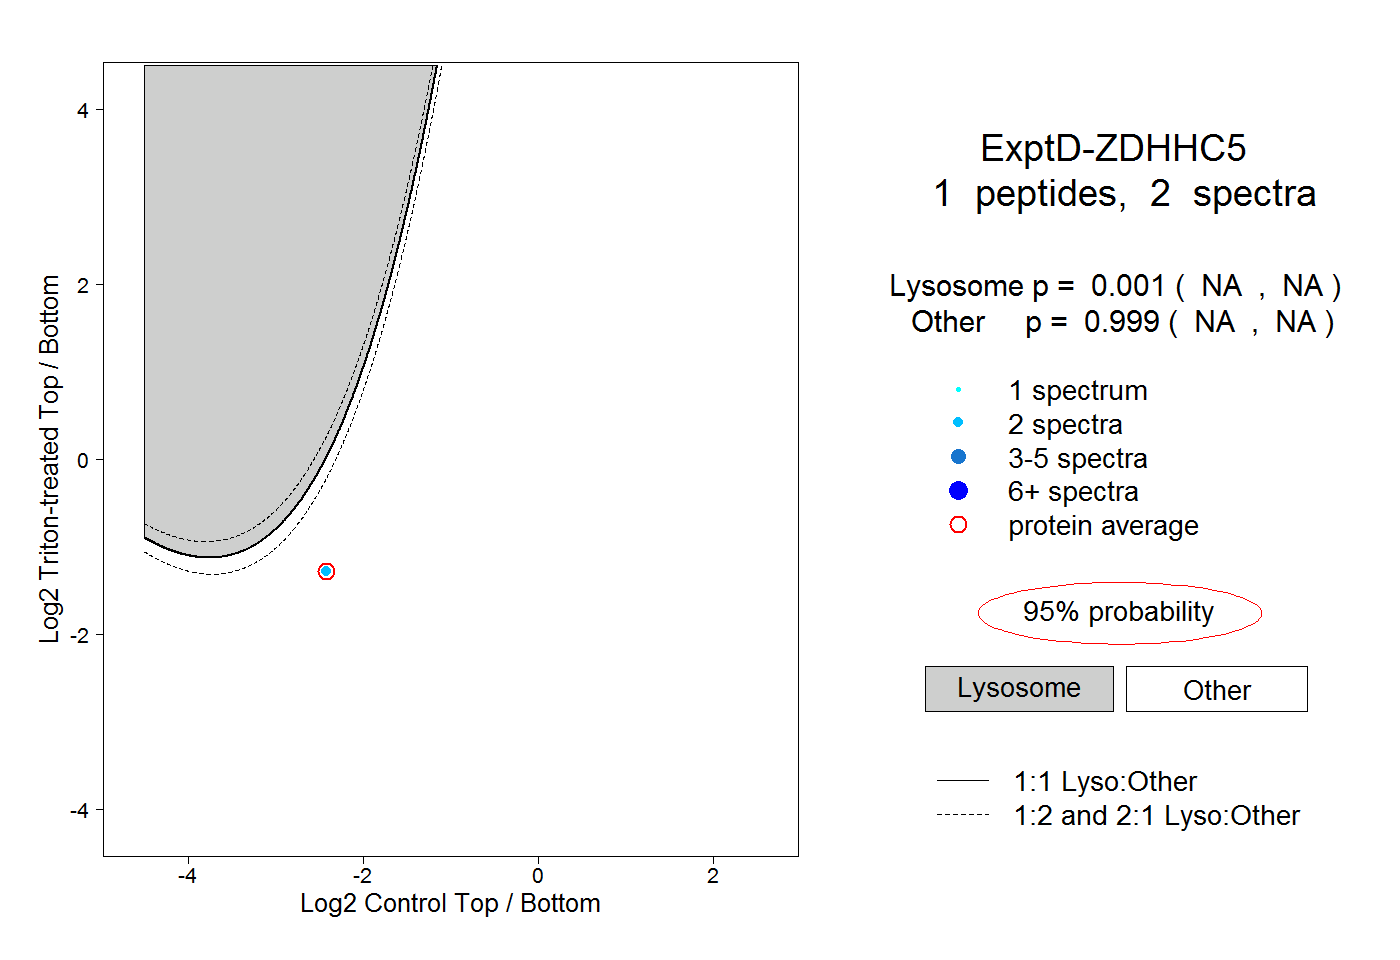 |
0.001 NA | NA |
0.999 NA | NA |