 11
11peptides
spectra

0.000 | 0.000
0.000 | 0.000
0.000 | 0.000
0.000 | 0.000
0.000 | 0.000
0.000 | 0.000
0.997 | 1.000
0.000 | 0.003
| Plot | Mito | Lyso | Perox | ER | Golgi | PM | Cytosol | Nucleus | |||||
| Expt A |
11 peptides |
40 spectra |
|
0.000 0.000 | 0.000 |
0.000 0.000 | 0.000 |
0.000 0.000 | 0.000 |
0.000 0.000 | 0.000 |
0.000 0.000 | 0.000 |
0.000 0.000 | 0.000 |
1.000 0.997 | 1.000 |
0.000 0.000 | 0.003 |
| 12 spectra, VFTAYDVFR | 0.000 | 0.000 | 0.000 | 0.000 | 0.000 | 0.000 | 1.000 | 0.000 | ||
| 6 spectra, SILGLLK | 0.000 | 0.025 | 0.000 | 0.000 | 0.000 | 0.000 | 0.975 | 0.000 | ||
| 4 spectra, AECPELSADLHPR | 0.051 | 0.000 | 0.080 | 0.013 | 0.000 | 0.000 | 0.795 | 0.061 | ||
| 1 spectrum, IAAVVTDSFPLK | 0.000 | 0.000 | 0.000 | 0.000 | 0.000 | 0.000 | 1.000 | 0.000 | ||
| 5 spectra, AGYHGVLR | 0.000 | 0.000 | 0.109 | 0.013 | 0.000 | 0.000 | 0.878 | 0.000 | ||
| 2 spectra, IHLHGNNYK | 0.000 | 0.000 | 0.000 | 0.000 | 0.000 | 0.000 | 0.908 | 0.092 | ||
| 3 spectra, QLNEQPDHSPLVQPGLAELR | 0.000 | 0.000 | 0.000 | 0.000 | 0.000 | 0.000 | 0.948 | 0.052 | ||
| 1 spectrum, VSLITSELIVQEVETQR | 0.000 | 0.000 | 0.000 | 0.000 | 0.000 | 0.000 | 1.000 | 0.000 | ||
| 1 spectrum, ISYWDPK | 0.000 | 0.000 | 0.000 | 0.000 | 0.000 | 0.000 | 0.972 | 0.028 | ||
| 4 spectra, DFDLDLAWR | 0.000 | 0.000 | 0.000 | 0.000 | 0.000 | 0.000 | 1.000 | 0.000 | ||
| 1 spectrum, DPTGSR | 0.000 | 0.045 | 0.000 | 0.000 | 0.003 | 0.000 | 0.952 | 0.000 |
| Plot | Mito | Lyso or Perox | ER | Golgi | PM | Cytosol | Nucleus | ||||||
| Expt B |
7 peptides |
24 spectra |
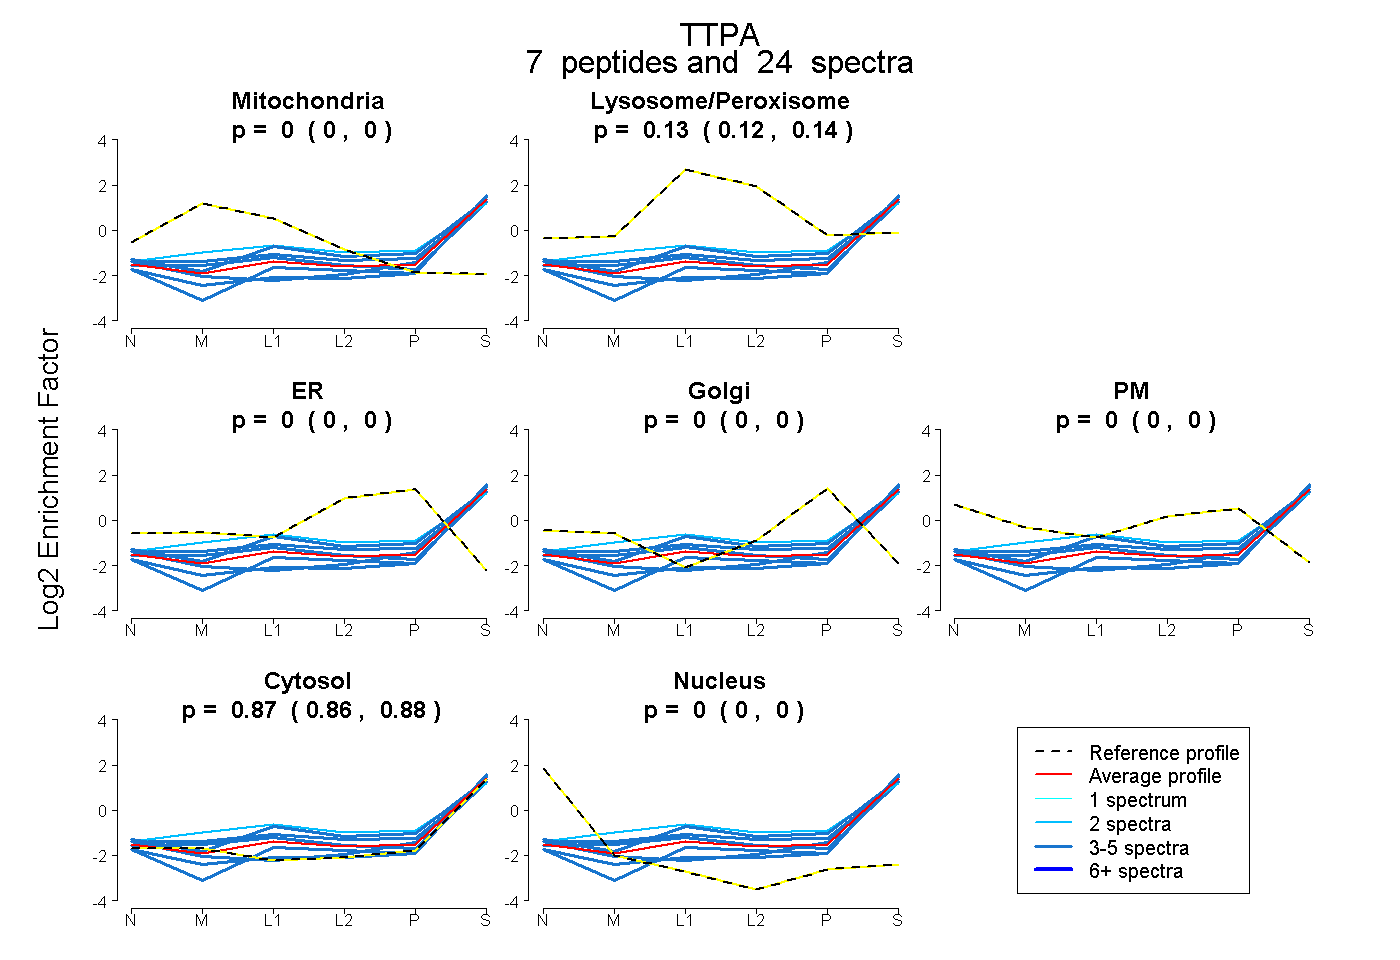 |
0.000 0.000 | 0.000 |
0.131 0.120 | 0.140 |
0.000 0.000 | 0.000 |
0.000 0.000 | 0.000 |
0.000 0.000 | 0.000 |
0.869 0.858 | 0.878 |
0.000 0.000 | 0.000 |
|||
| Plot | Lyso | Other | |||||||||||
| Expt C |
8 peptides |
61 spectra |
 |
0.000 0.000 | 0.000 |
1.000 1.000 | 1.000 |
||||||||
| Plot | Lyso | Other | |||||||||||
| Expt D |
5 peptides |
8 spectra |
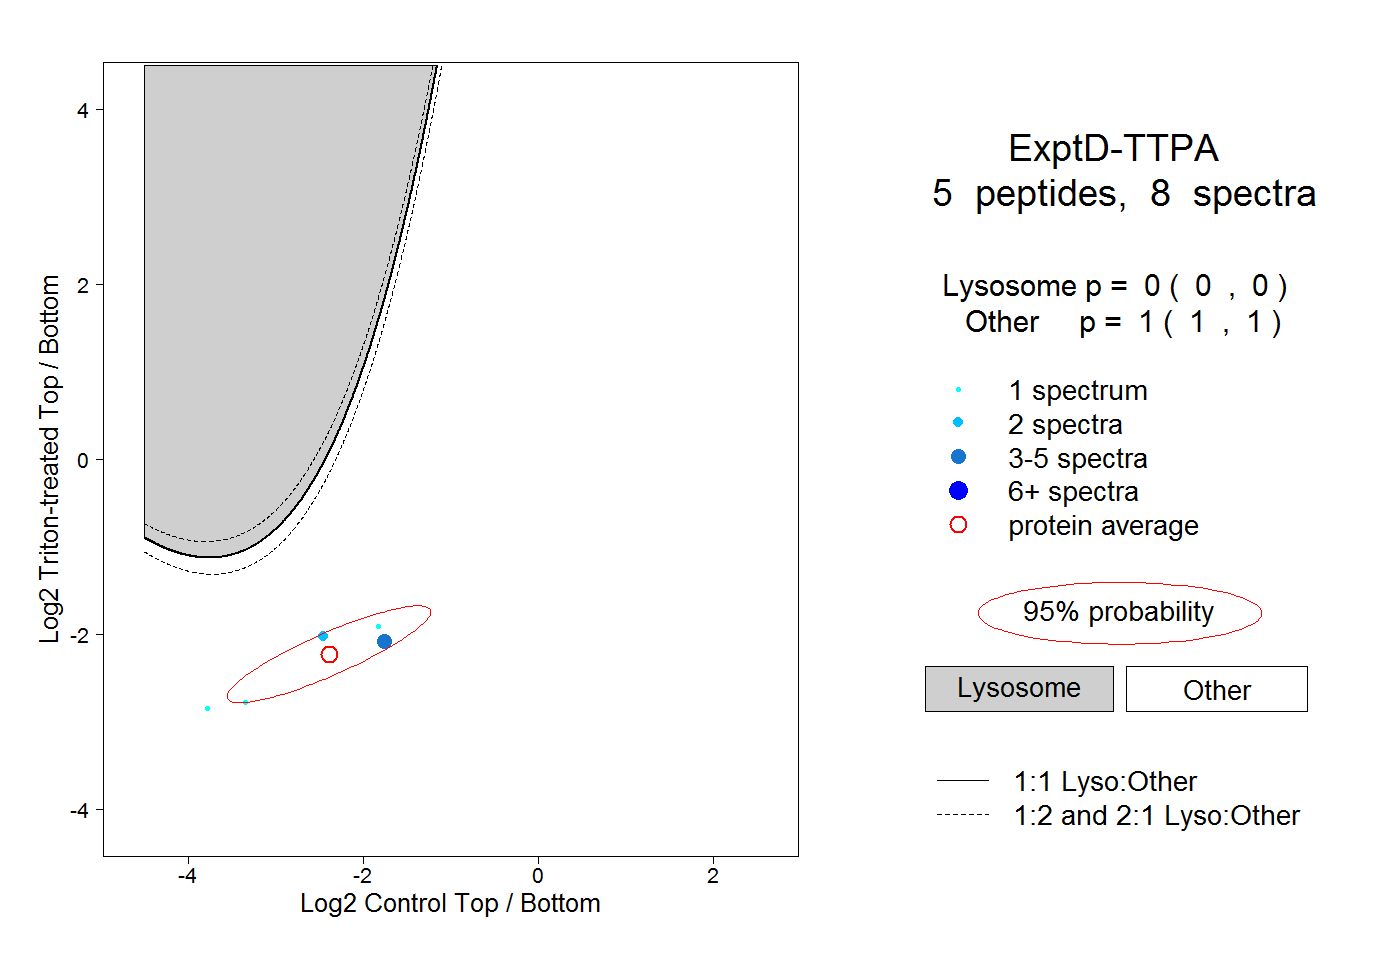 |
0.000 0.000 | 0.000 |
1.000 1.000 | 1.000 |