 13
13peptides
spectra
0.000 | 0.000
0.000 | 0.000
0.000 | 0.000
0.919 | 0.927
0.000 | 0.000
0.000 | 0.000
0.000 | 0.000
0.073 | 0.081
| Plot | Mito | Lyso | Perox | ER | Golgi | PM | Cytosol | Nucleus | |||||
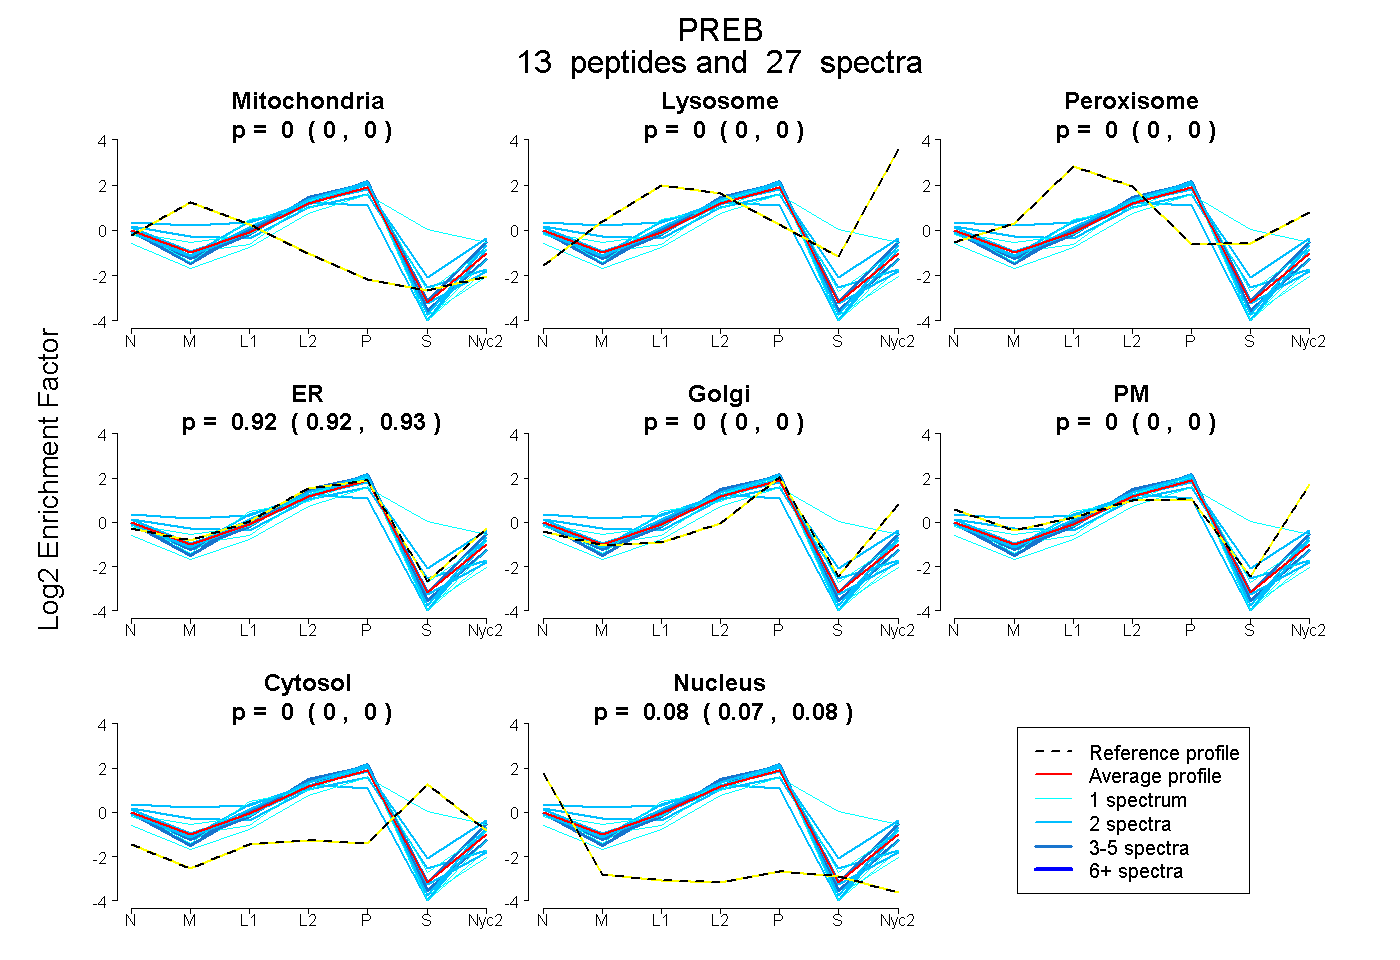
| Expt A |
13 peptides |
27 spectra |
|
0.000 0.000 | 0.000 |
0.000 0.000 | 0.000 |
0.000 0.000 | 0.000 |
0.923 0.919 | 0.927 |
0.000 0.000 | 0.000 |
0.000 0.000 | 0.000 |
0.000 0.000 | 0.000 |
0.077 0.073 | 0.081 |
| 1 spectrum, GAAPAEK | 0.000 | 0.000 | 0.000 | 0.916 | 0.000 | 0.000 | 0.000 | 0.084 | ||
| 2 spectra, CQLHLLPSR | 0.111 | 0.000 | 0.000 | 0.799 | 0.000 | 0.000 | 0.000 | 0.091 | ||
| 2 spectra, VVCFNHDNTLLATGGTDGHVR | 0.000 | 0.000 | 0.000 | 0.881 | 0.000 | 0.000 | 0.000 | 0.119 | ||
| 2 spectra, ASVWQK | 0.203 | 0.000 | 0.000 | 0.661 | 0.000 | 0.137 | 0.000 | 0.000 | ||
| 1 spectrum, LVTVGWDFK | 0.000 | 0.000 | 0.000 | 0.582 | 0.000 | 0.000 | 0.418 | 0.000 | ||
| 5 spectra, FGQVPDQPGGLR | 0.000 | 0.000 | 0.000 | 0.963 | 0.000 | 0.000 | 0.000 | 0.037 | ||
| 1 spectrum, EAHGIVVTDVTFLPEK | 0.000 | 0.000 | 0.000 | 0.874 | 0.000 | 0.000 | 0.000 | 0.126 | ||
| 1 spectrum, LFTVQIPHK | 0.020 | 0.000 | 0.000 | 0.903 | 0.000 | 0.000 | 0.000 | 0.078 | ||
| 2 spectra, GVELYR | 0.000 | 0.000 | 0.000 | 0.958 | 0.000 | 0.000 | 0.000 | 0.042 | ||
| 1 spectrum, LLGPHETALFSVAVDSR | 0.000 | 0.000 | 0.000 | 0.932 | 0.000 | 0.000 | 0.000 | 0.068 | ||
| 5 spectra, APFPLYALR | 0.000 | 0.000 | 0.000 | 0.916 | 0.000 | 0.000 | 0.000 | 0.084 | ||
| 2 spectra, TGLLIAAGGGGAAK | 0.000 | 0.000 | 0.000 | 0.966 | 0.000 | 0.000 | 0.000 | 0.034 | ||
| 2 spectra, SGAEVHPEGVELK | 0.000 | 0.000 | 0.000 | 0.855 | 0.007 | 0.053 | 0.066 | 0.019 |
| Plot | Mito | Lyso or Perox | ER | Golgi | PM | Cytosol | Nucleus | ||||||
| Expt B |
8 peptides |
16 spectra |
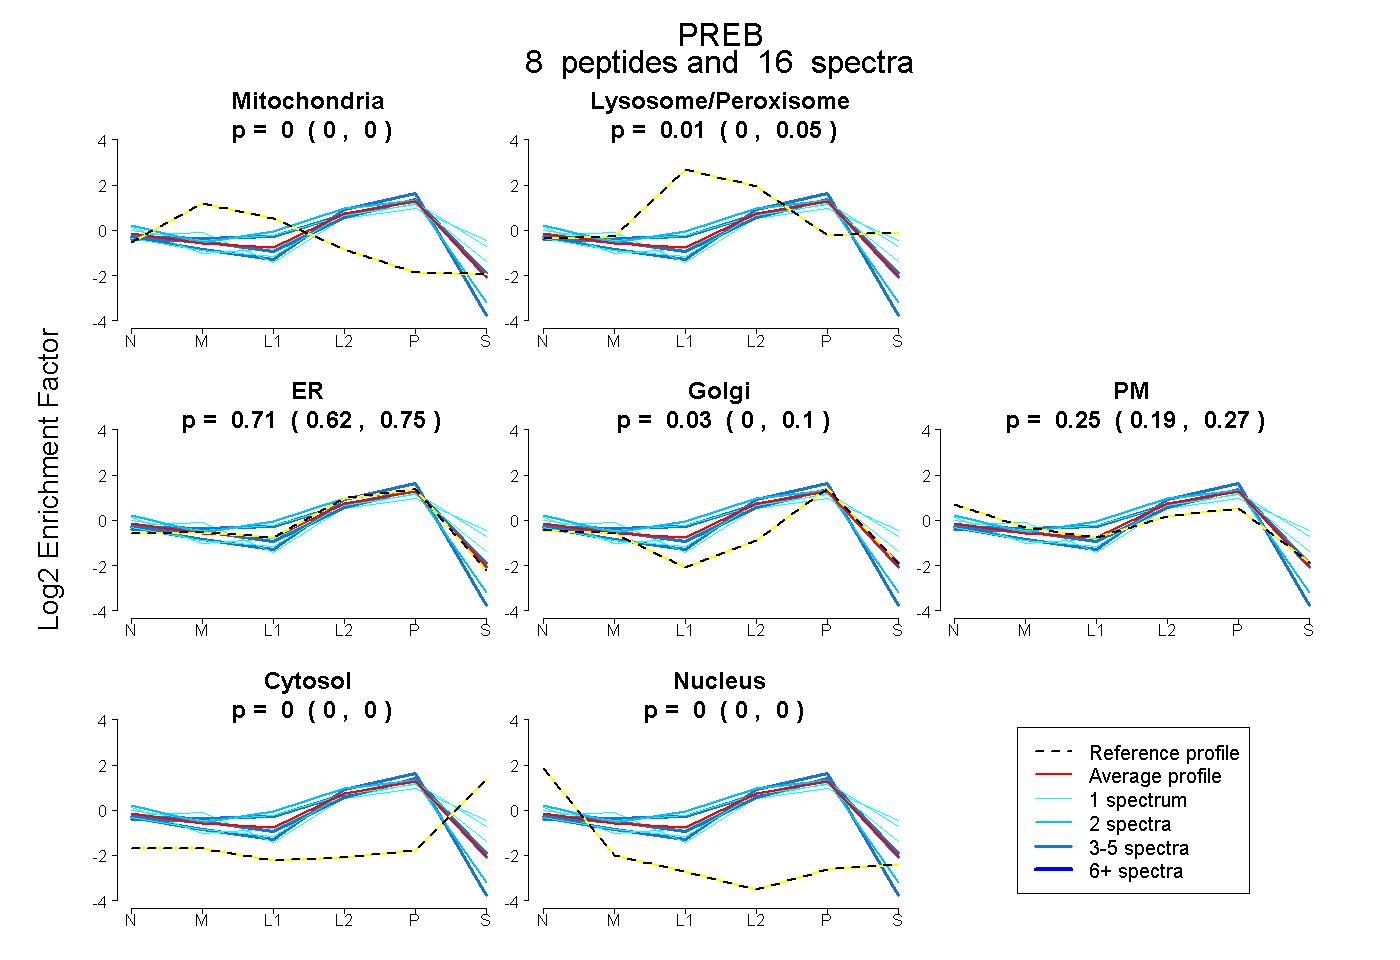 |
0.000 0.000 | 0.000 |
0.006 0.000 | 0.052 |
0.712 0.625 | 0.746 |
0.031 0.000 | 0.102 |
0.250 0.194 | 0.269 |
0.000 0.000 | 0.000 |
0.000 0.000 | 0.000 |
|||
| Plot | Lyso | Other | |||||||||||
| Expt C |
10 peptides |
40 spectra |
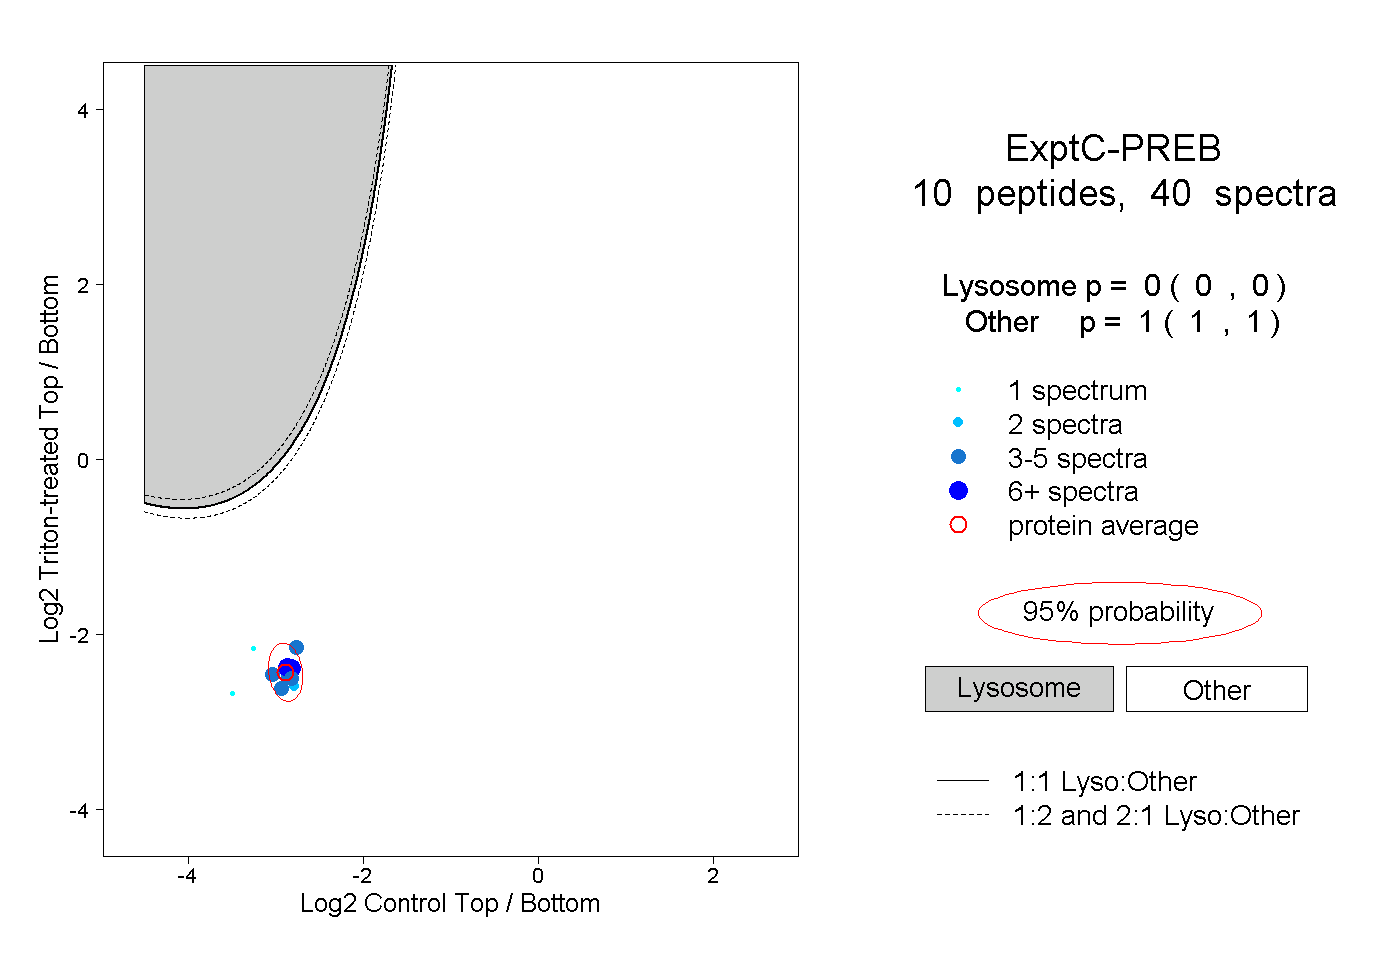 |
0.000 0.000 | 0.000 |
1.000 1.000 | 1.000 |
||||||||
| Plot | Lyso | Other | |||||||||||
| Expt D |
5 peptides |
10 spectra |
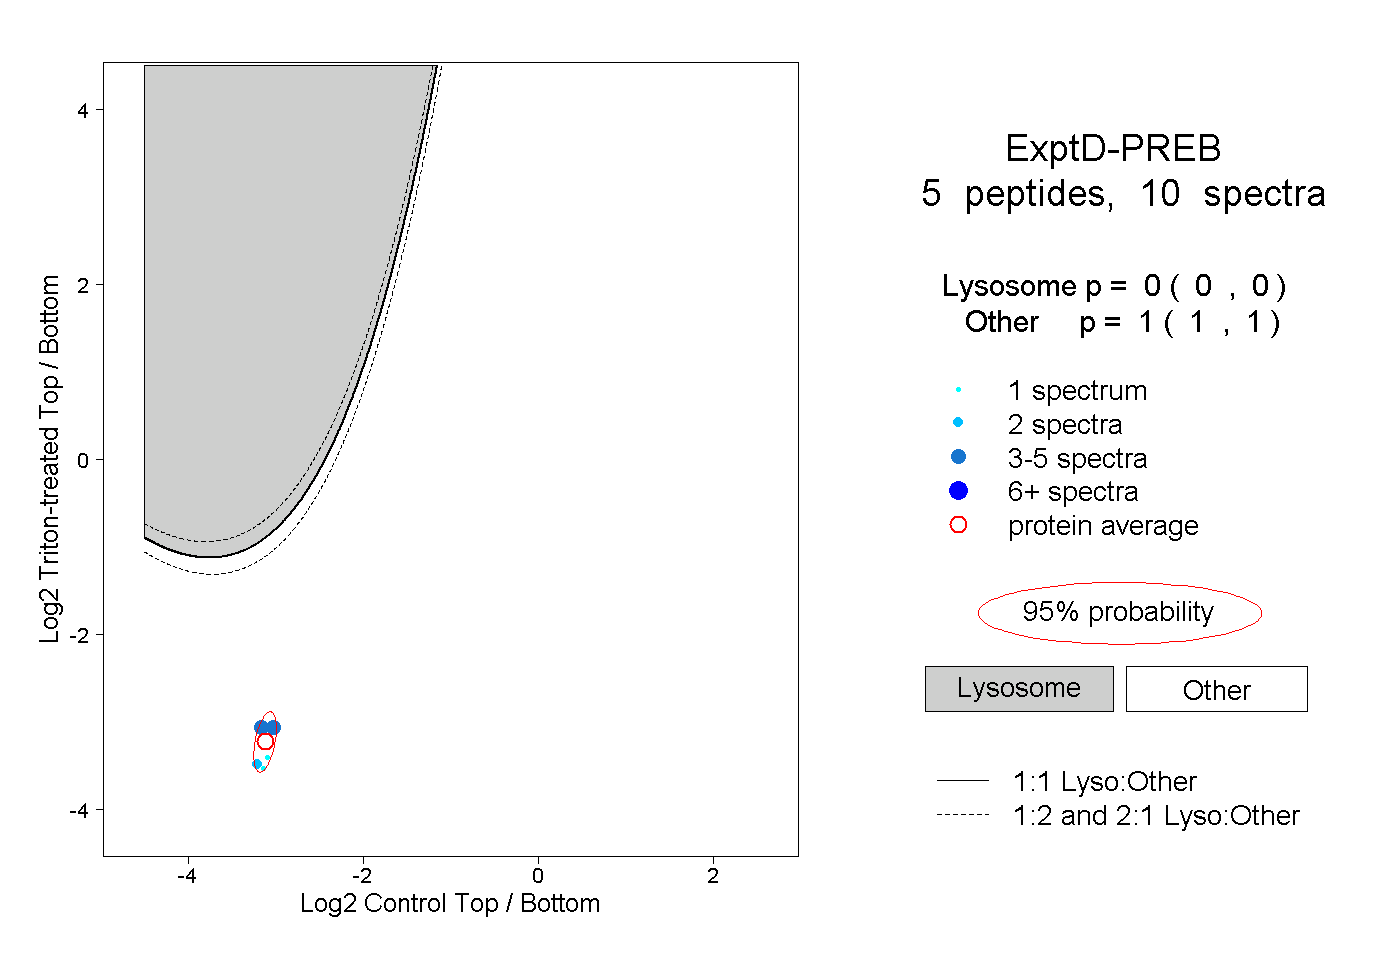 |
0.000 0.000 | 0.000 |
1.000 1.000 | 1.000 |