 5
5peptides
spectra
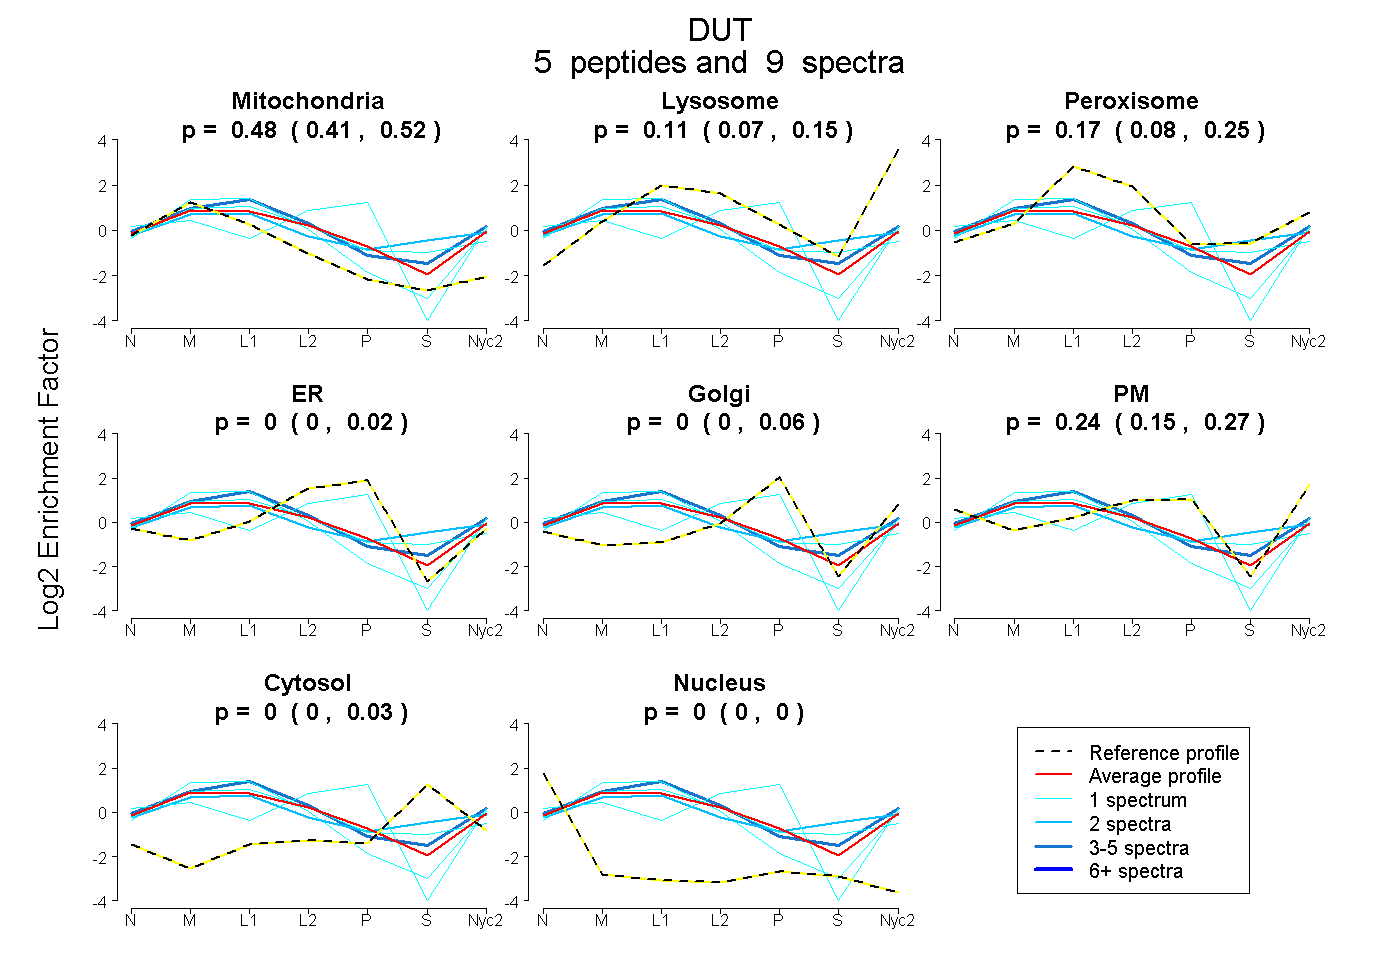
0.414 | 0.517
0.070 | 0.150
0.077 | 0.254
0.000 | 0.024
0.000 | 0.062
0.149 | 0.272
0.000 | 0.028
0.000 | 0.000
1peptide
spectrum

NA | NA
NA | NA
NA | NA
NA | NA
NA | NA
NA | NA
NA | NA
7peptides
spectra
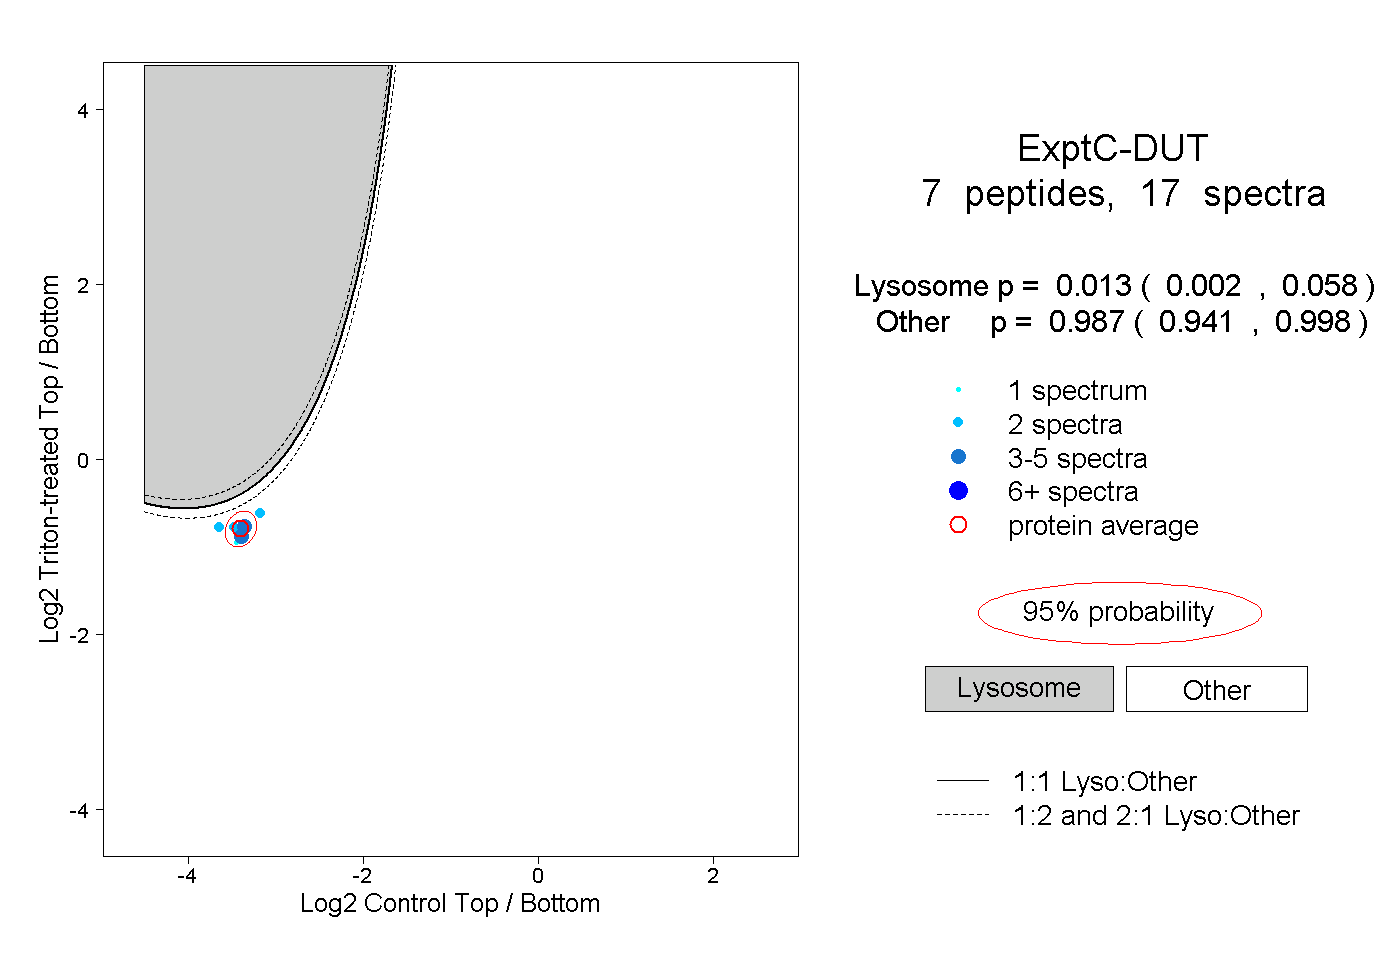
0.002 | 0.058
0.941 | 0.998
1peptide
spectrum
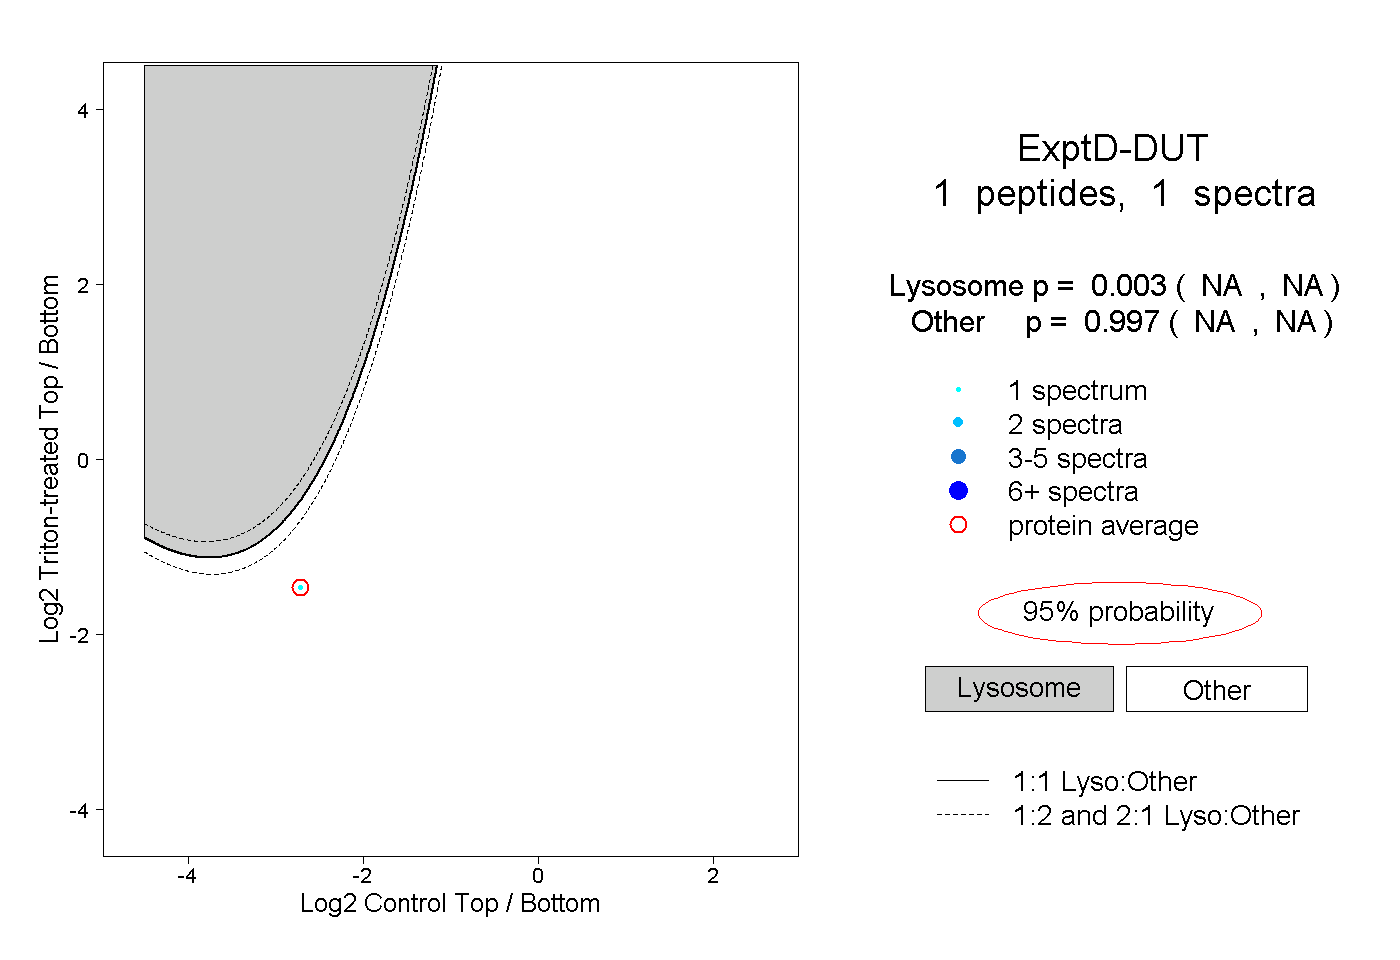
NA | NA
NA | NA