 2
2peptides
spectra
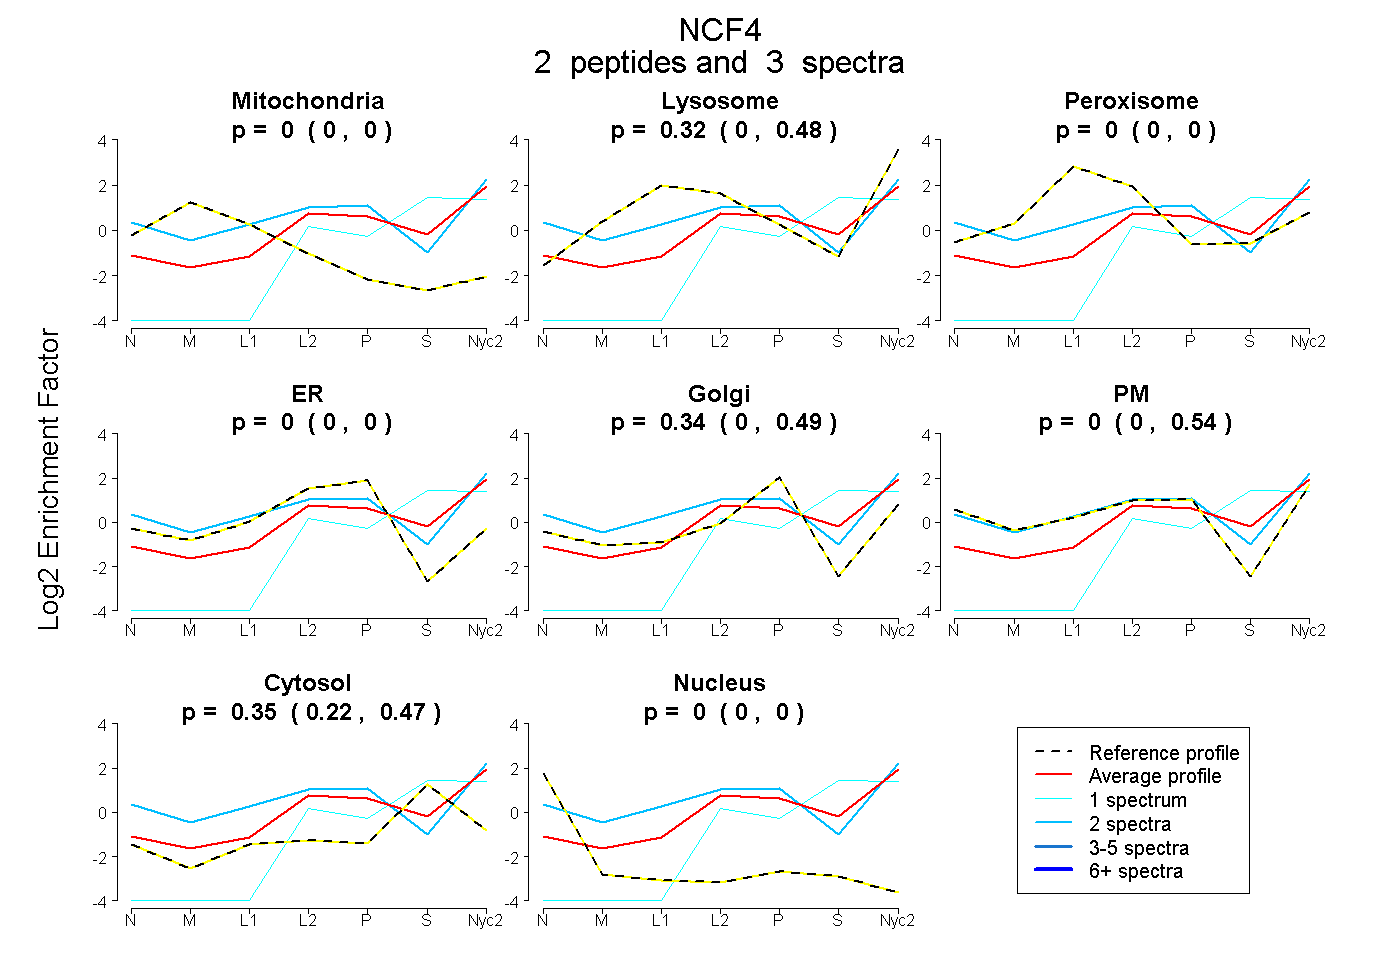
0.000 | 0.000
0.000 | 0.481
0.000 | 0.000
0.000 | 0.000
0.000 | 0.491
0.000 | 0.538
0.218 | 0.468
0.000 | 0.000
| Plot | Mito | Lyso | Perox | ER | Golgi | PM | Cytosol | Nucleus | |||||
| Expt A |
2 peptides |
3 spectra |
|
0.000 0.000 | 0.000 |
0.317 0.000 | 0.481 |
0.000 0.000 | 0.000 |
0.000 0.000 | 0.000 |
0.337 0.000 | 0.491 |
0.000 0.000 | 0.538 |
0.346 0.218 | 0.468 |
0.000 0.000 | 0.000 |
| 2 spectra, YLIYR | 0.000 | 0.237 | 0.000 | 0.000 | 0.000 | 0.662 | 0.101 | 0.000 | ||
| 1 spectrum, AGDVIFLLSK | 0.000 | 0.014 | 0.000 | 0.000 | 0.057 | 0.000 | 0.929 | 0.000 |
| Plot | Lyso | Other | |||||||||||
| Expt C |
2 peptides |
4 spectra |
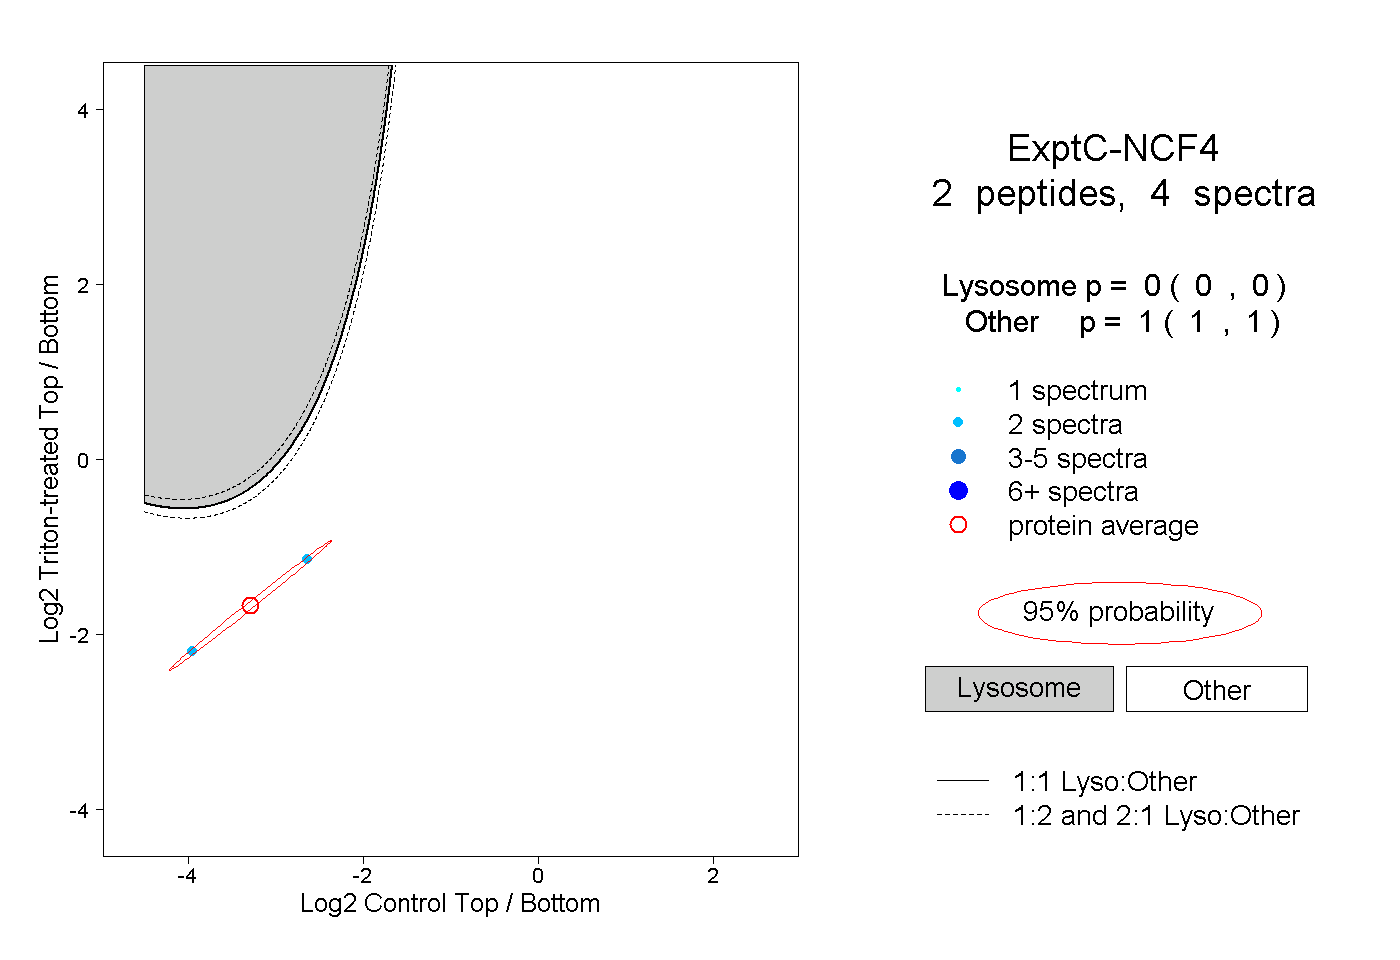 |
0.000 0.000 | 0.000 |
1.000 1.000 | 1.000 |