 16
16peptides
spectra
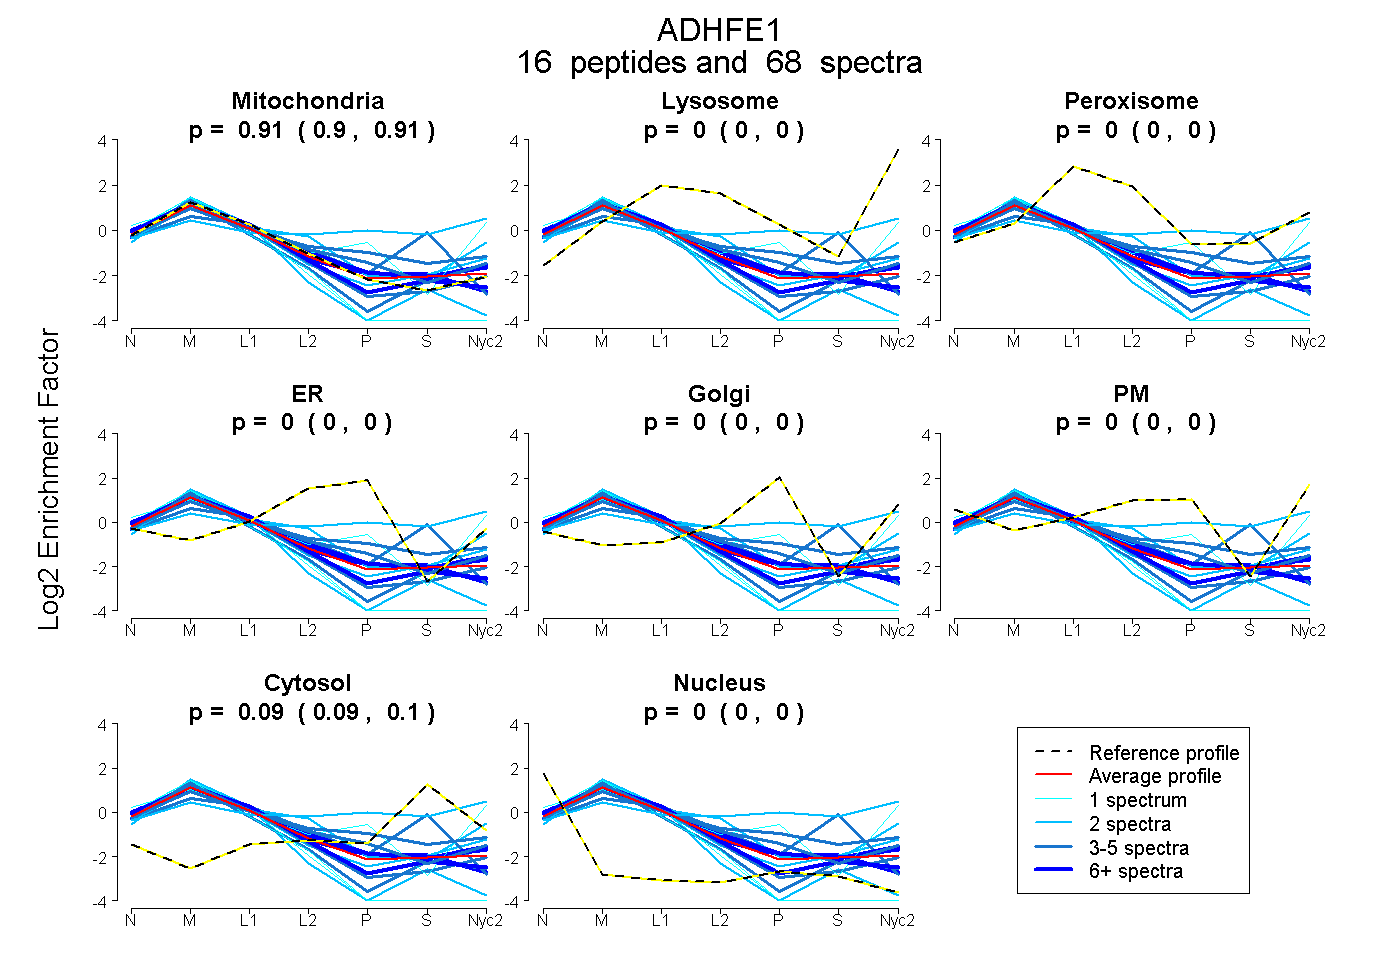
0.899 | 0.913
0.000 | 0.000
0.000 | 0.002
0.000 | 0.000
0.000 | 0.000
0.000 | 0.000
0.086 | 0.098
0.000 | 0.000
8peptides
spectra
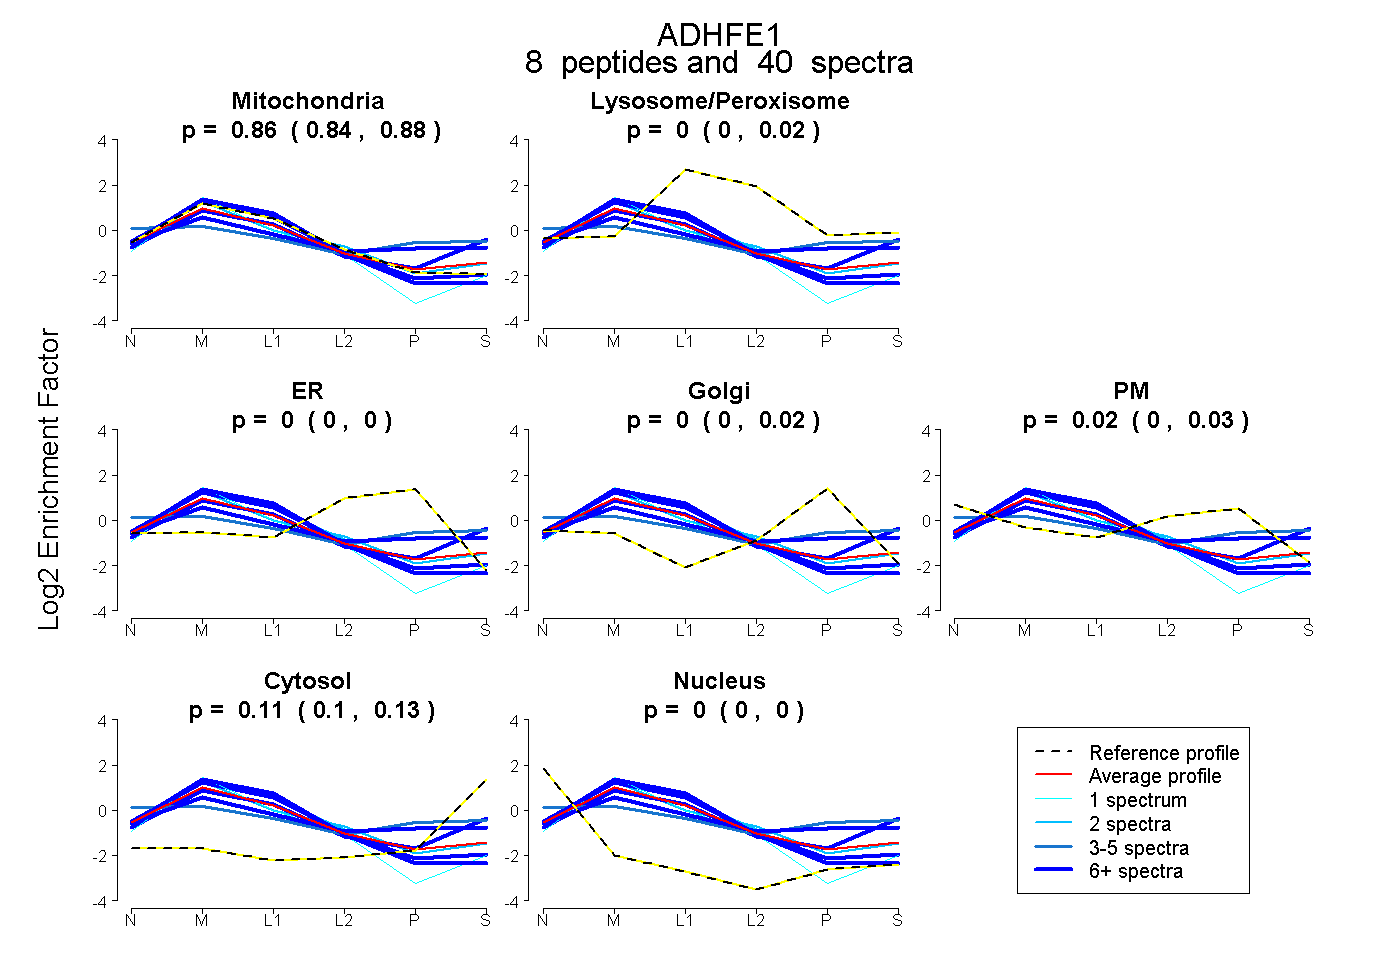
0.838 | 0.879
0.000 | 0.018
0.000 | 0.000
0.000 | 0.019
0.000 | 0.032
0.098 | 0.126
0.000 | 0.000
14peptides
spectra
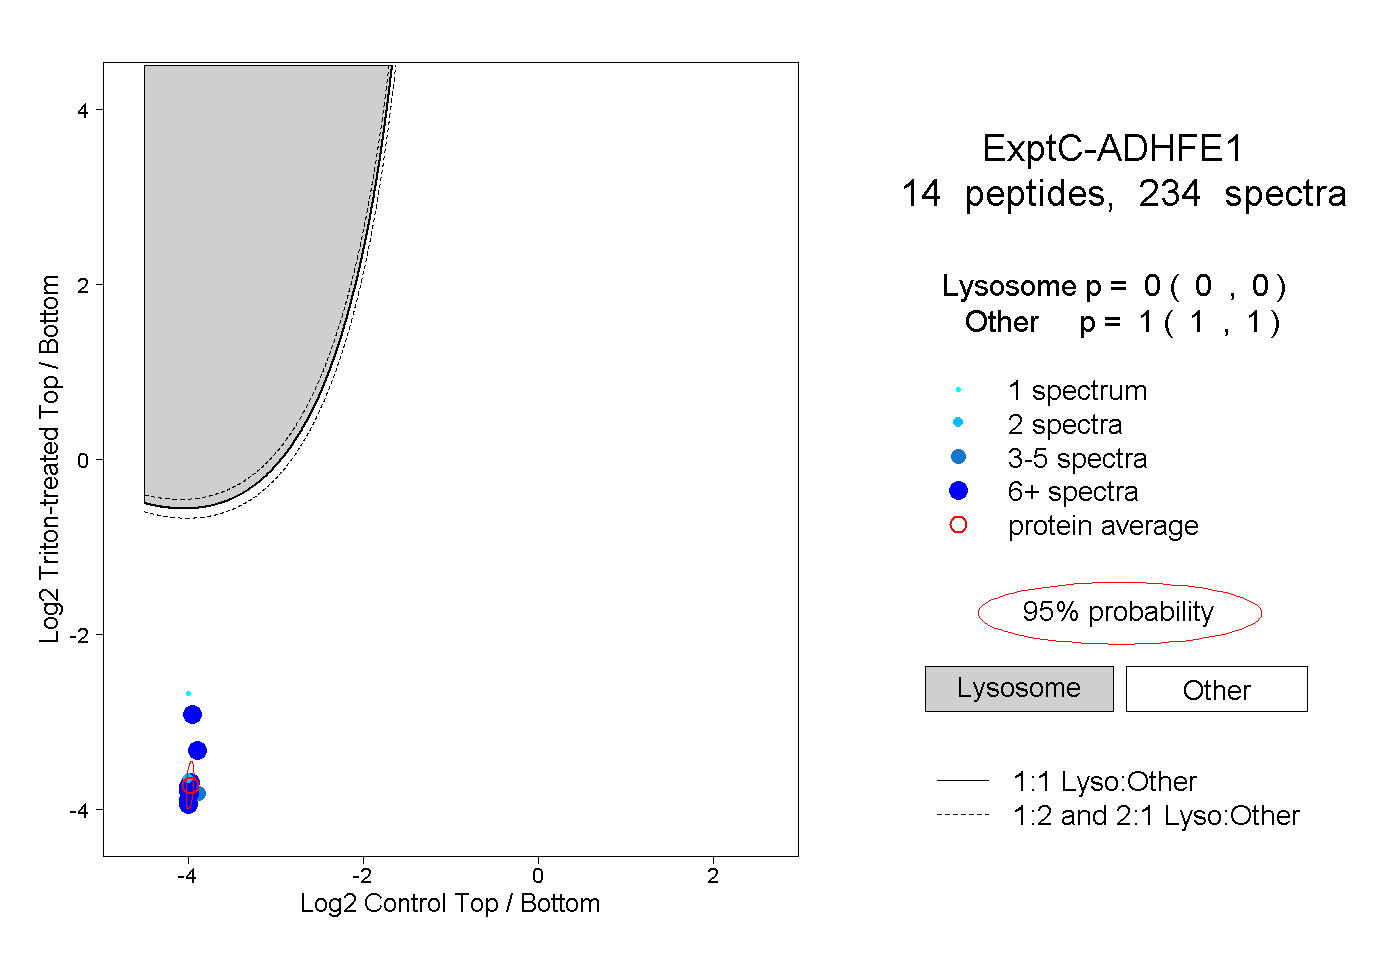
0.000 | 0.000
1.000 | 1.000
10peptides
spectra
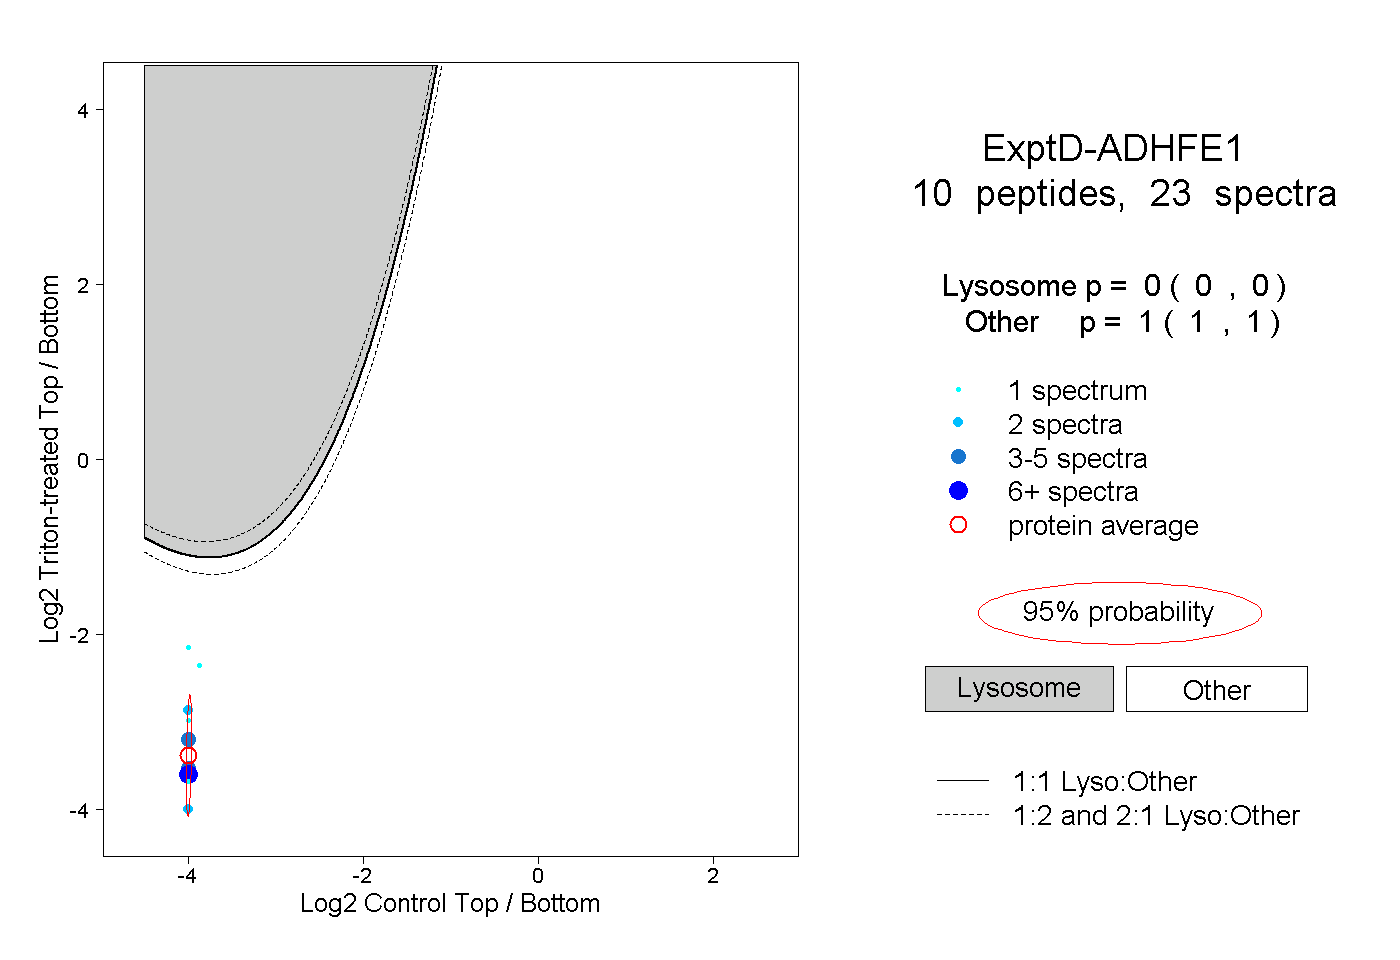
0.000 | 0.000
1.000 | 1.000