 4
4peptides
spectra

0.566 | 0.634
0.000 | 0.000
0.082 | 0.147
0.000 | 0.000
0.000 | 0.000
0.000 | 0.000
0.267 | 0.286
0.000 | 0.000
3peptides
spectra
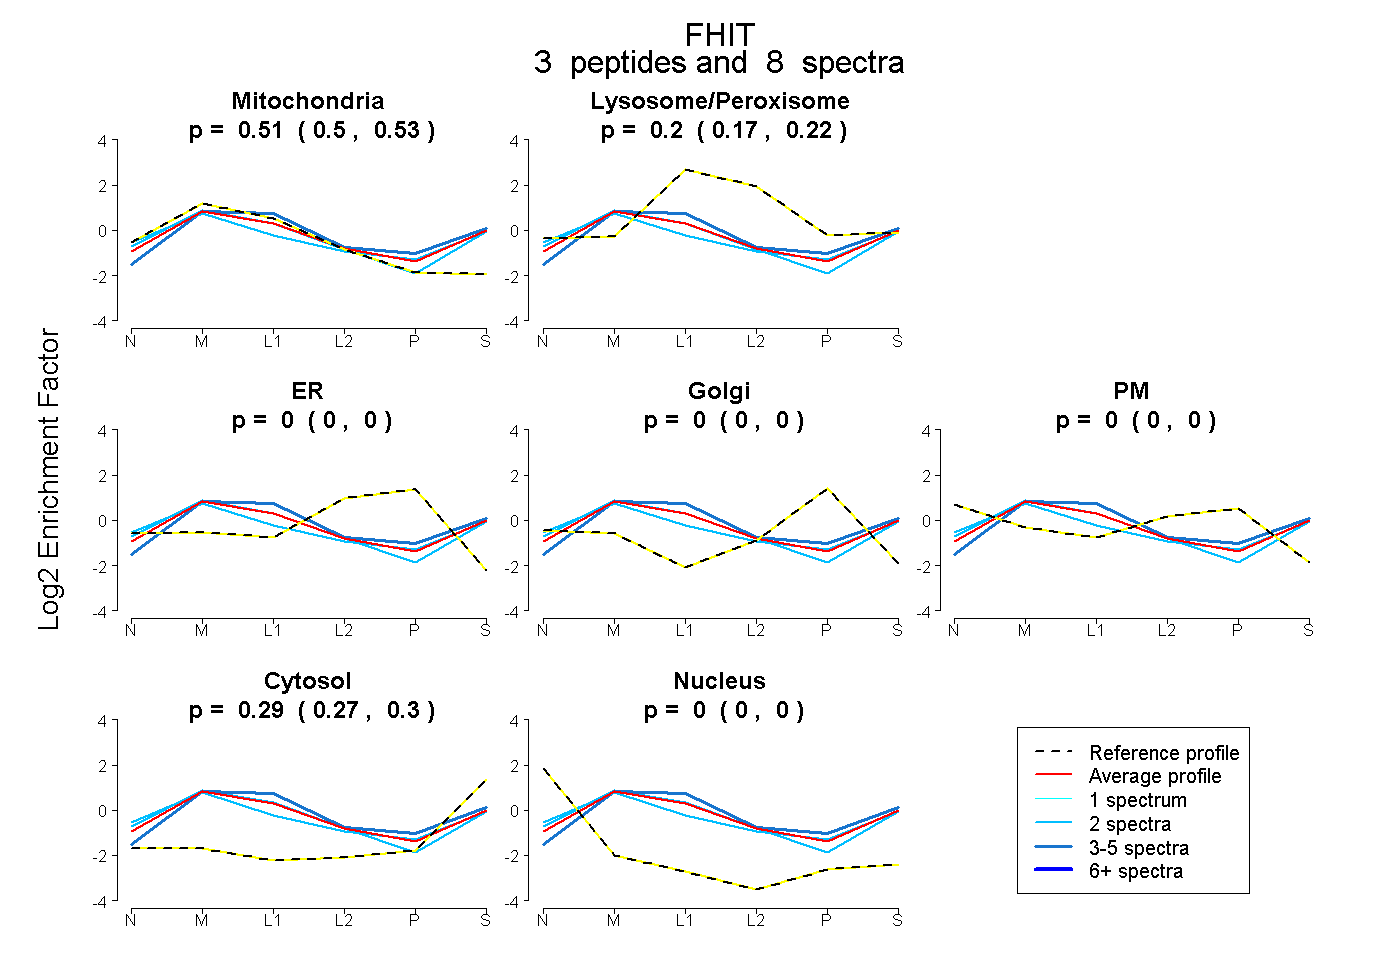
0.497 | 0.531
0.171 | 0.219
0.000 | 0.000
0.000 | 0.000
0.000 | 0.000
0.266 | 0.305
0.000 | 0.000
3peptides
spectra

0.000 | 0.000
1.000 | 1.000