 6
6peptides
spectra
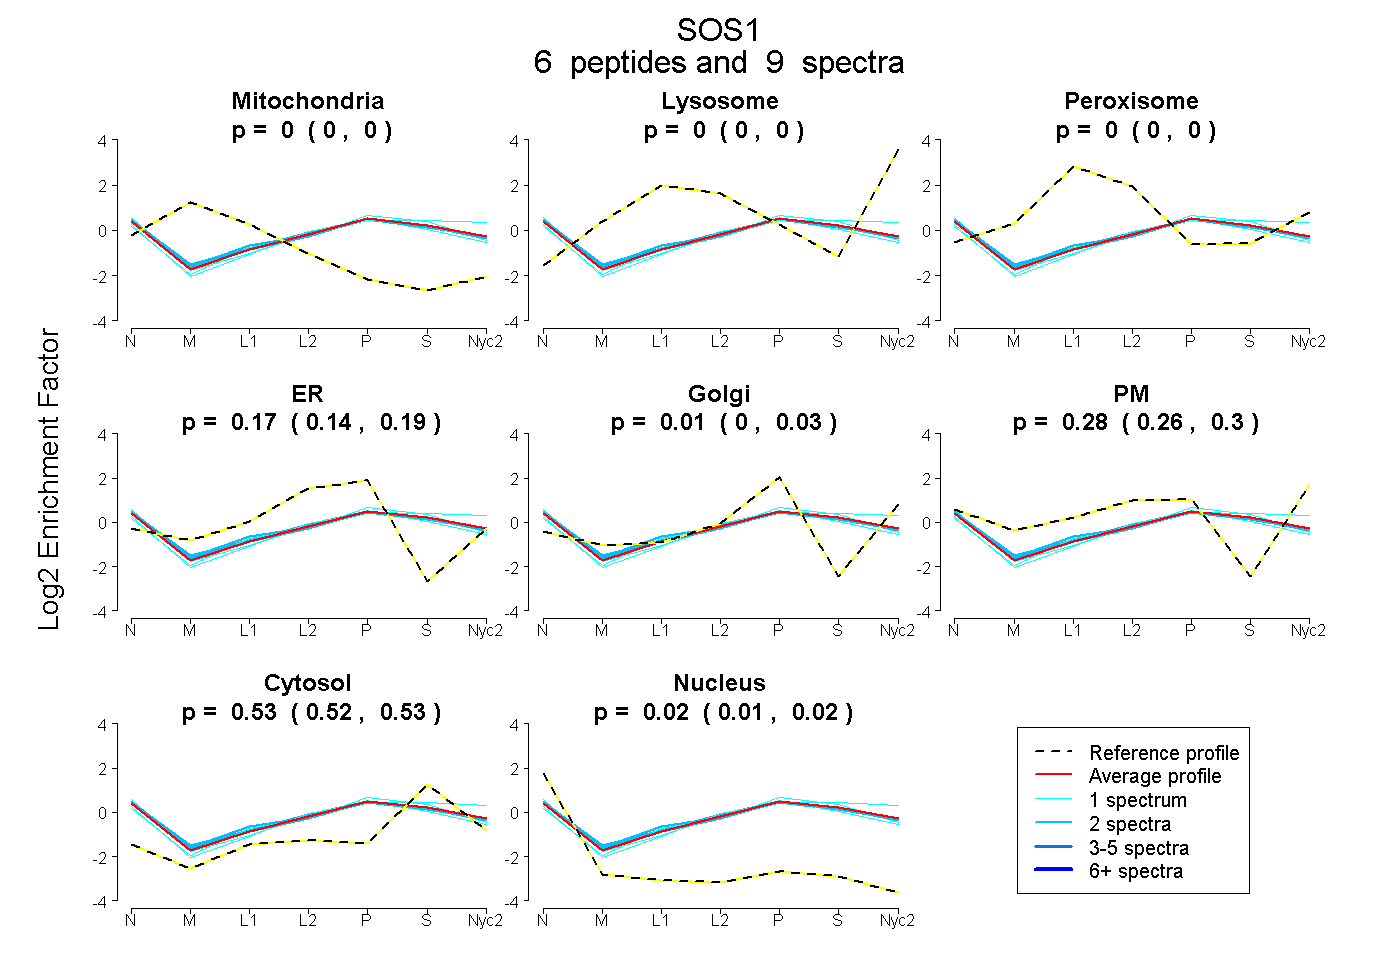
0.000 | 0.000
0.000 | 0.000
0.000 | 0.000
0.138 | 0.191
0.000 | 0.026
0.256 | 0.300
0.518 | 0.531
0.012 | 0.024
5peptides
spectra
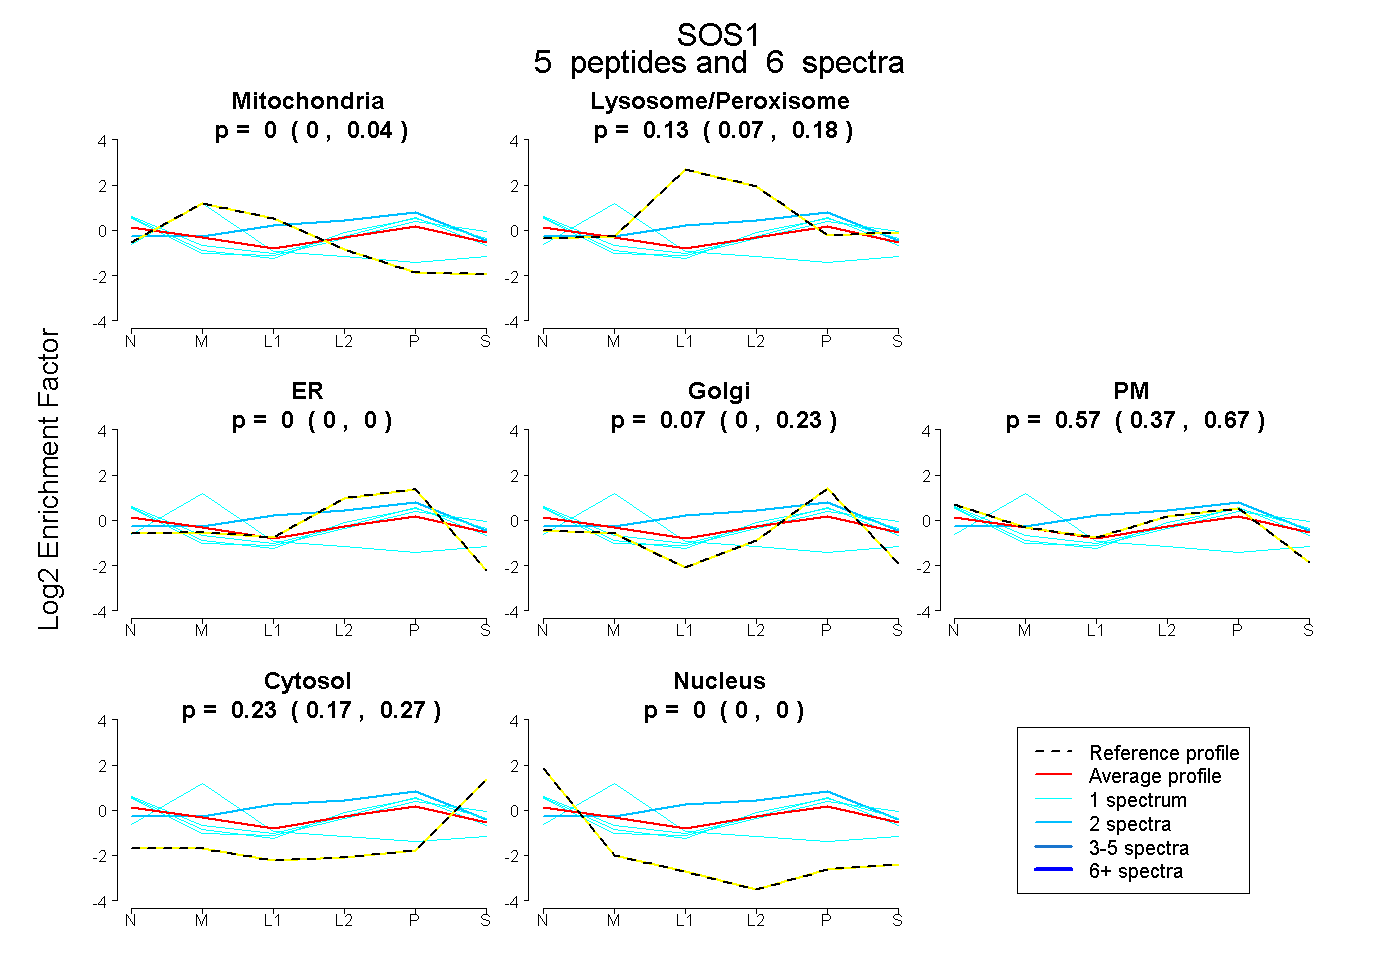
0.000 | 0.039
0.068 | 0.183
0.000 | 0.000
0.000 | 0.229
0.372 | 0.666
0.173 | 0.275
0.000 | 0.000
5peptides
spectra
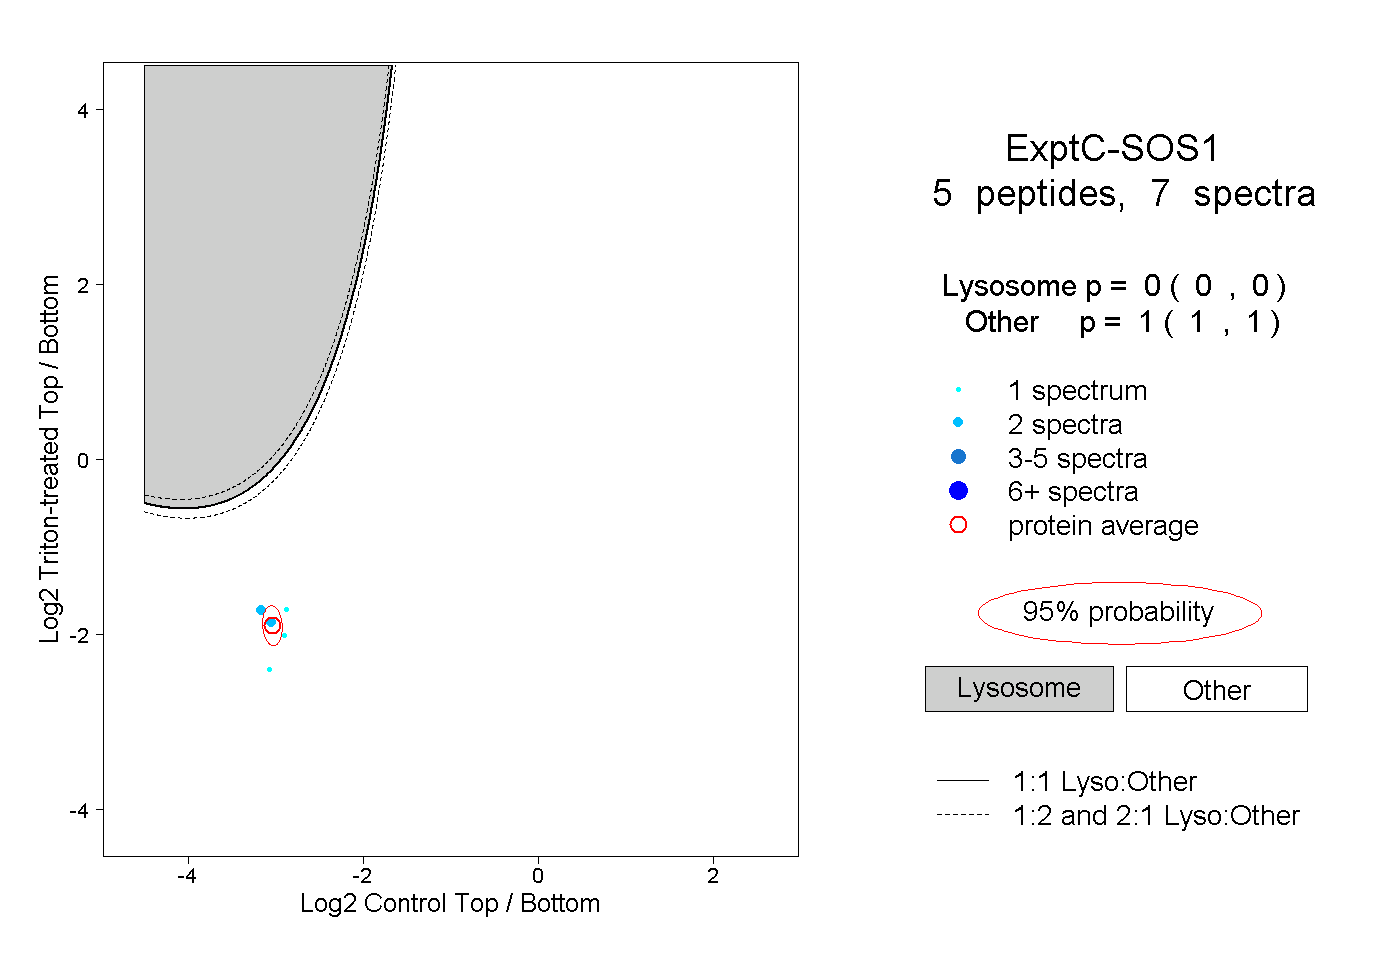
0.000 | 0.000
1.000 | 1.000
1peptide
spectrum
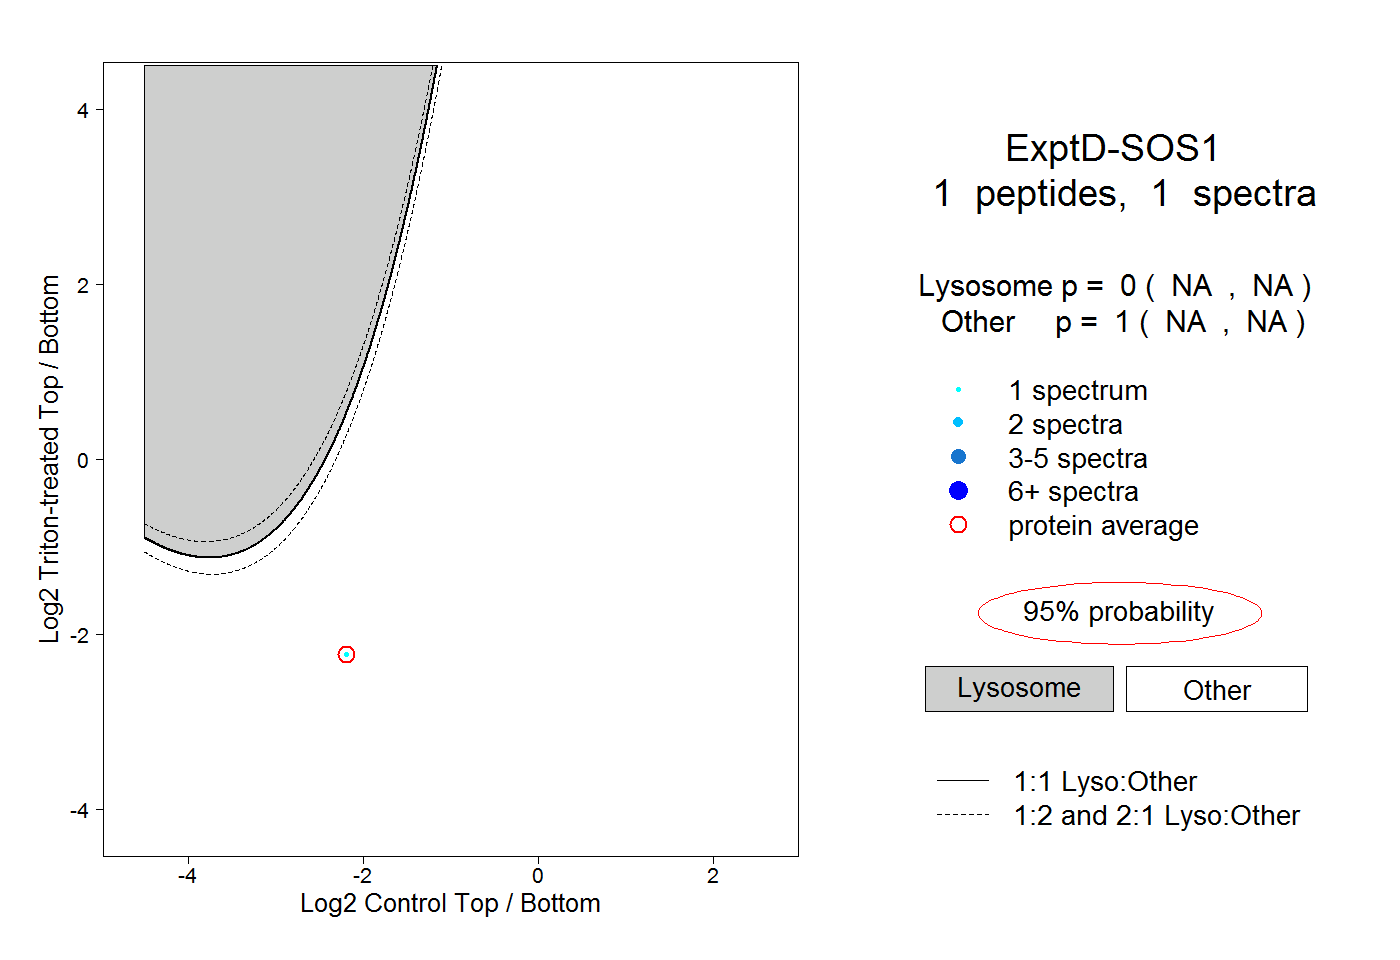
NA | NA
NA | NA