21
21peptides
spectra
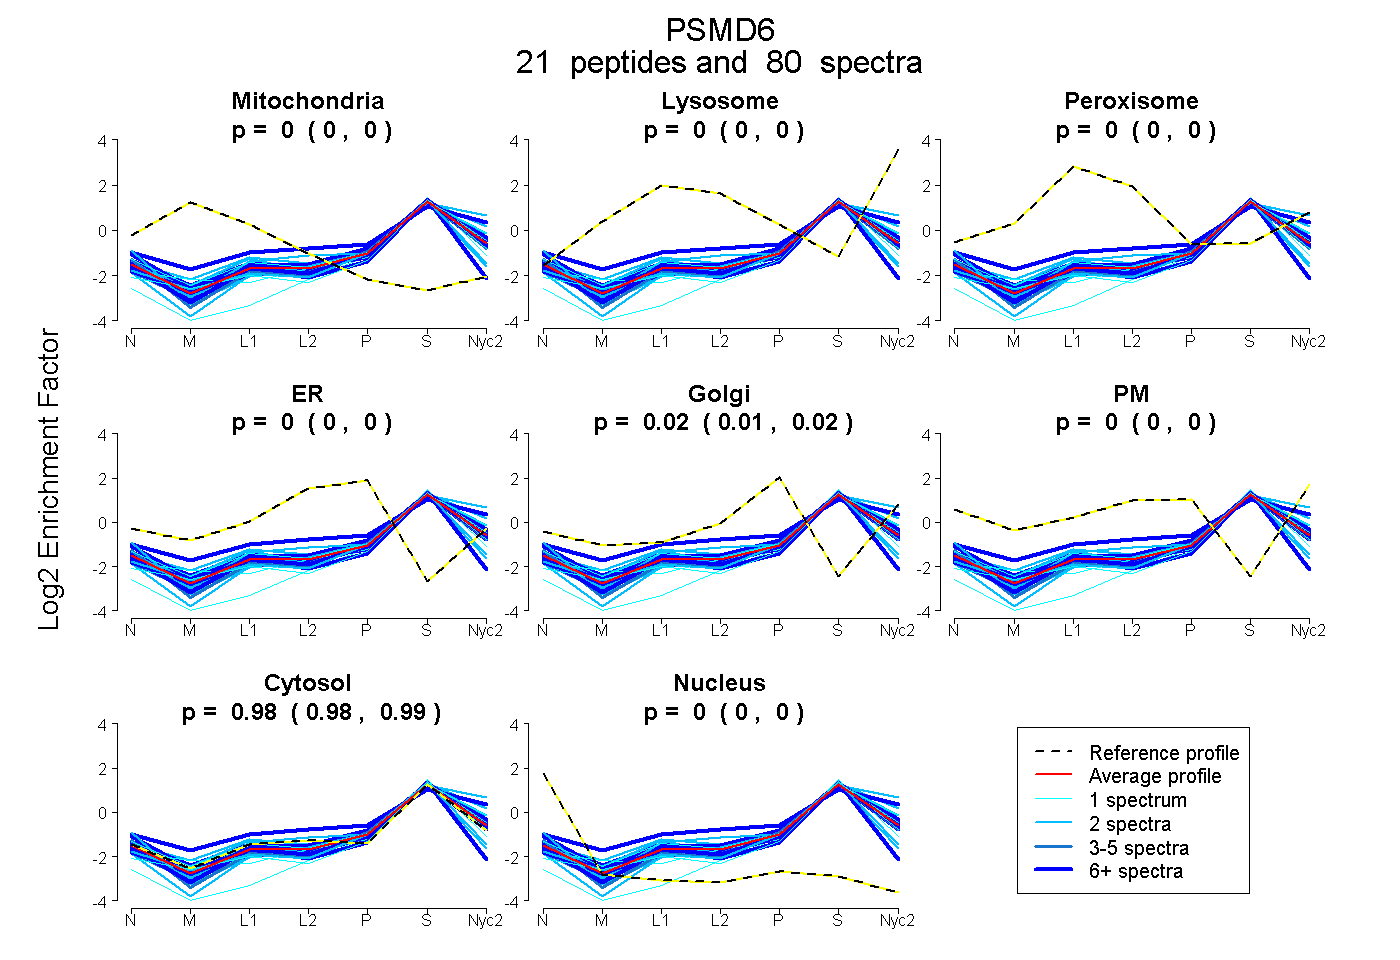
0.000 | 0.000
0.000 | 0.000
0.000 | 0.000
0.000 | 0.000
0.014 | 0.018
0.000 | 0.000
0.981 | 0.986
0.000 | 0.000
11peptides
spectra
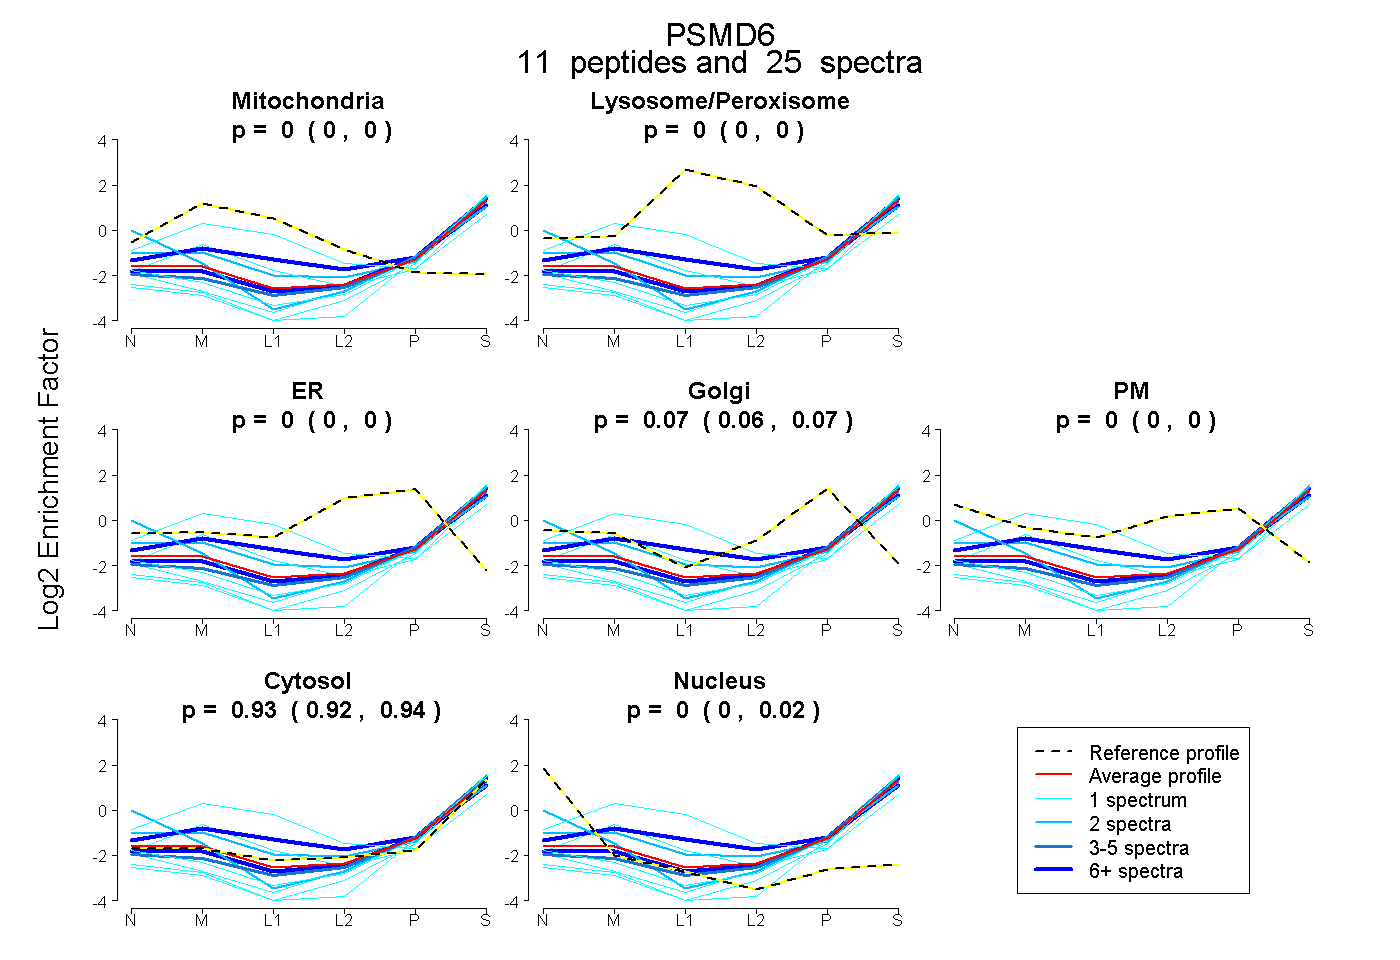
0.000 | 0.000
0.000 | 0.000
0.000 | 0.000
0.056 | 0.073
0.000 | 0.000
0.919 | 0.938
0.000 | 0.015