 13
13peptides
spectra
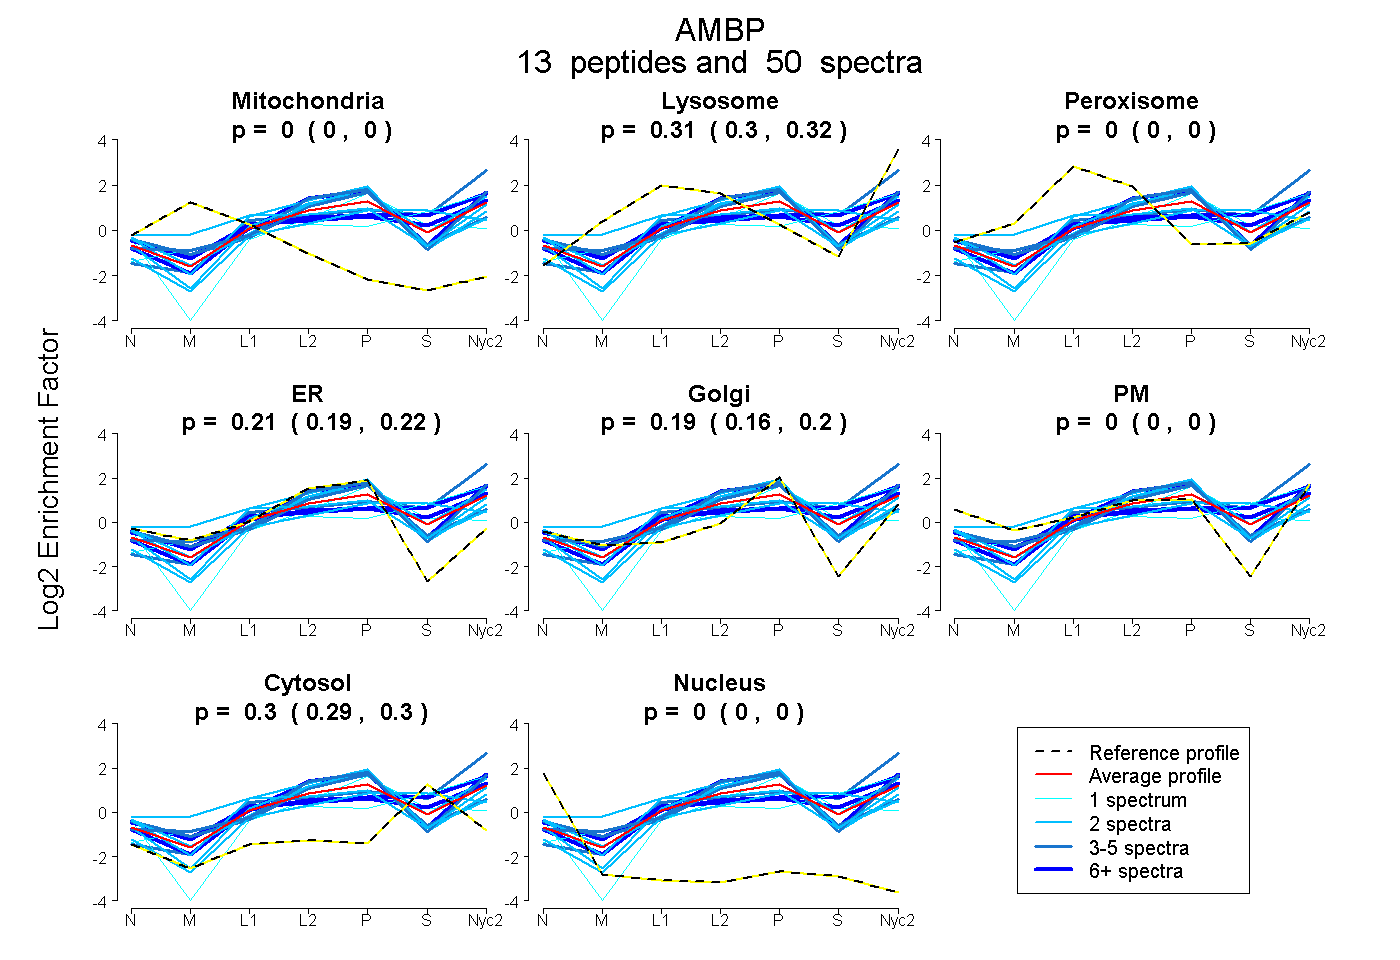
0.000 | 0.000
0.302 | 0.319
0.000 | 0.000
0.188 | 0.225
0.164 | 0.203
0.000 | 0.000
0.288 | 0.304
0.000 | 0.000
8peptides
spectra
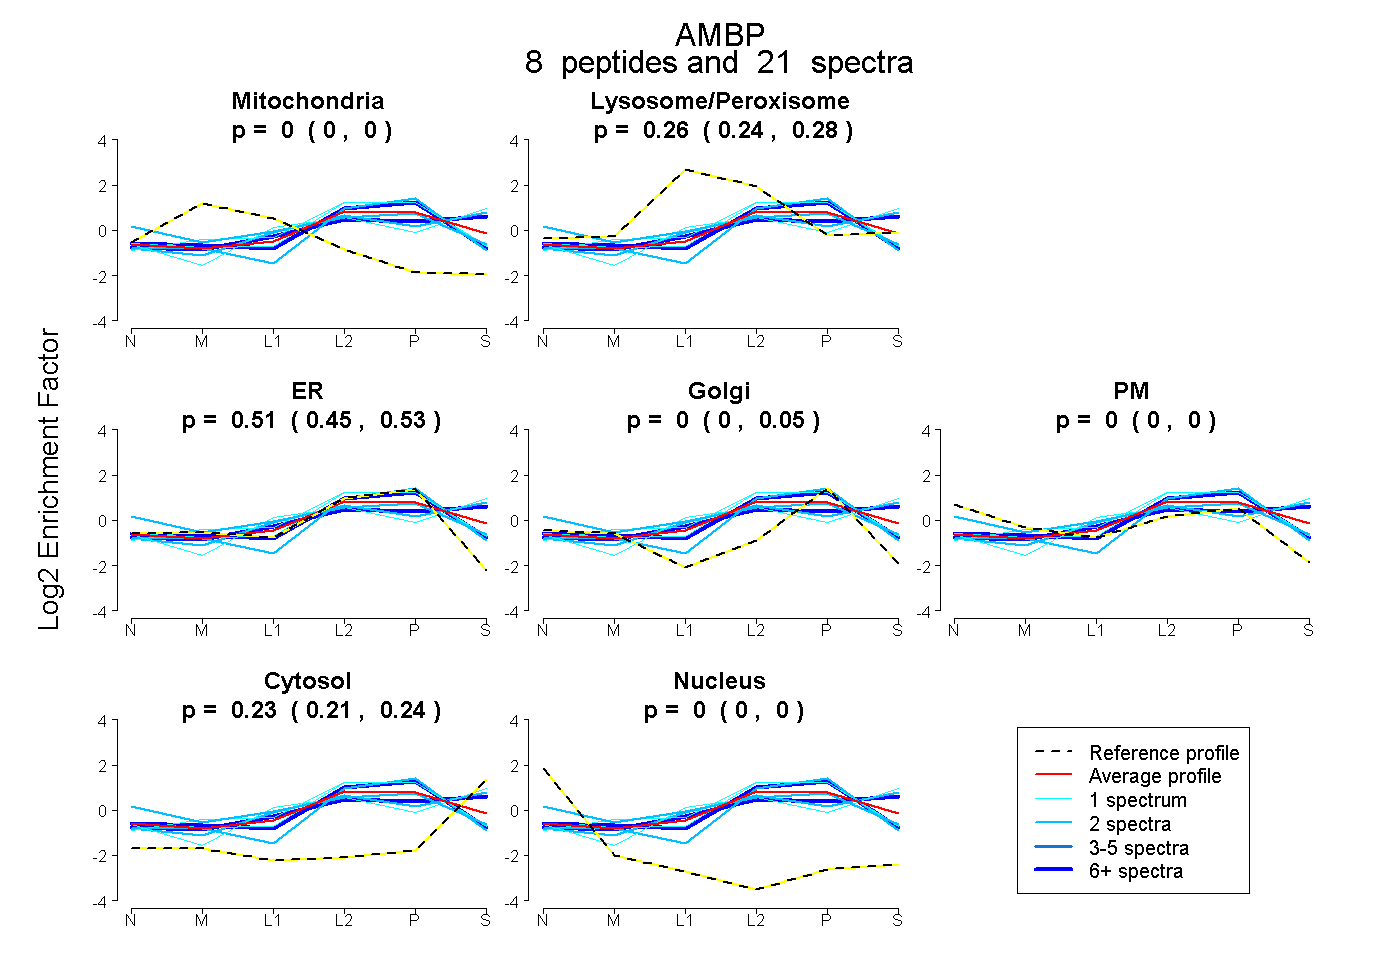
0.000 | 0.000
0.237 | 0.279
0.445 | 0.531
0.000 | 0.046
0.000 | 0.000
0.210 | 0.244
0.000 | 0.000
10peptides
spectra
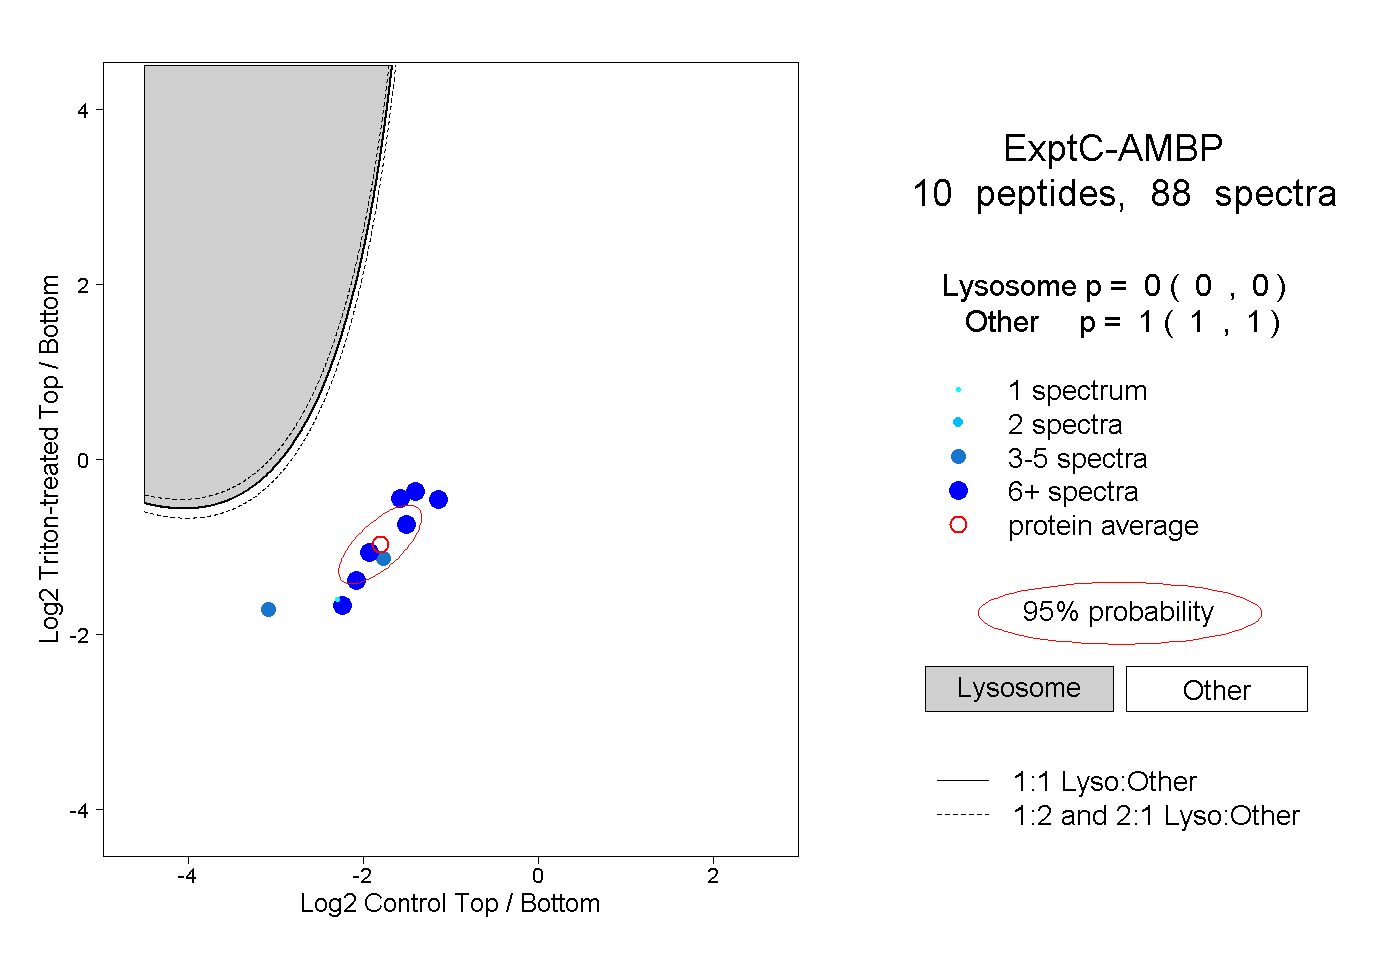
0.000 | 0.000
1.000 | 1.000
6peptides
spectra
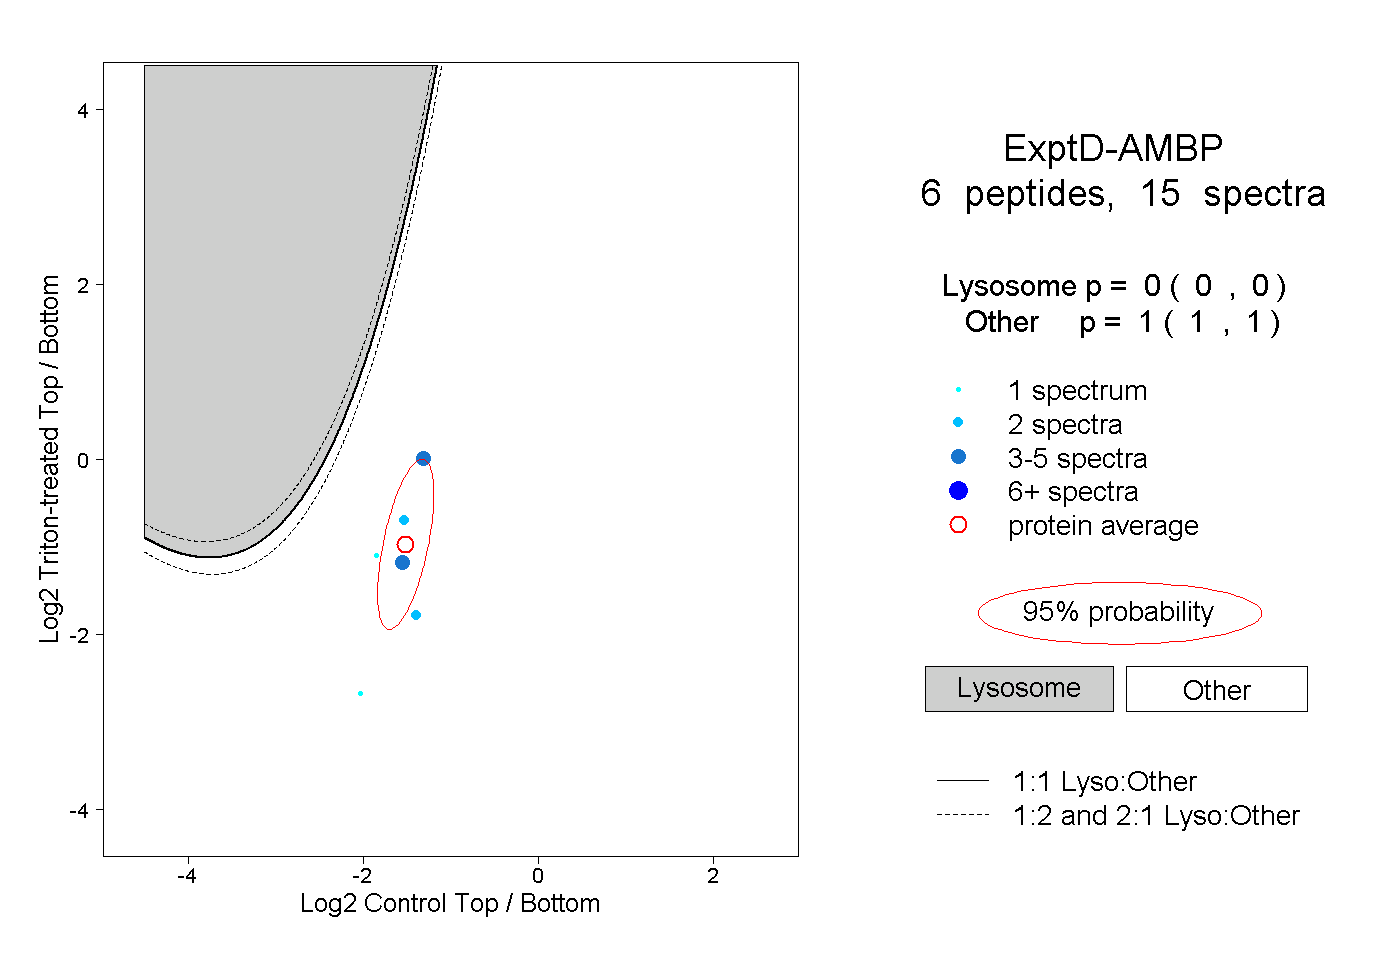
0.000 | 0.000
1.000 | 1.000