RRAGA
[ENSRNOP00000009225]
Main page
| | | Plot |
Mito |
Lyso |
|
Perox |
ER |
Golgi |
PM |
Cytosol |
Nucleus |
|
| Expt A |
 9
9
peptides |
24
spectra |
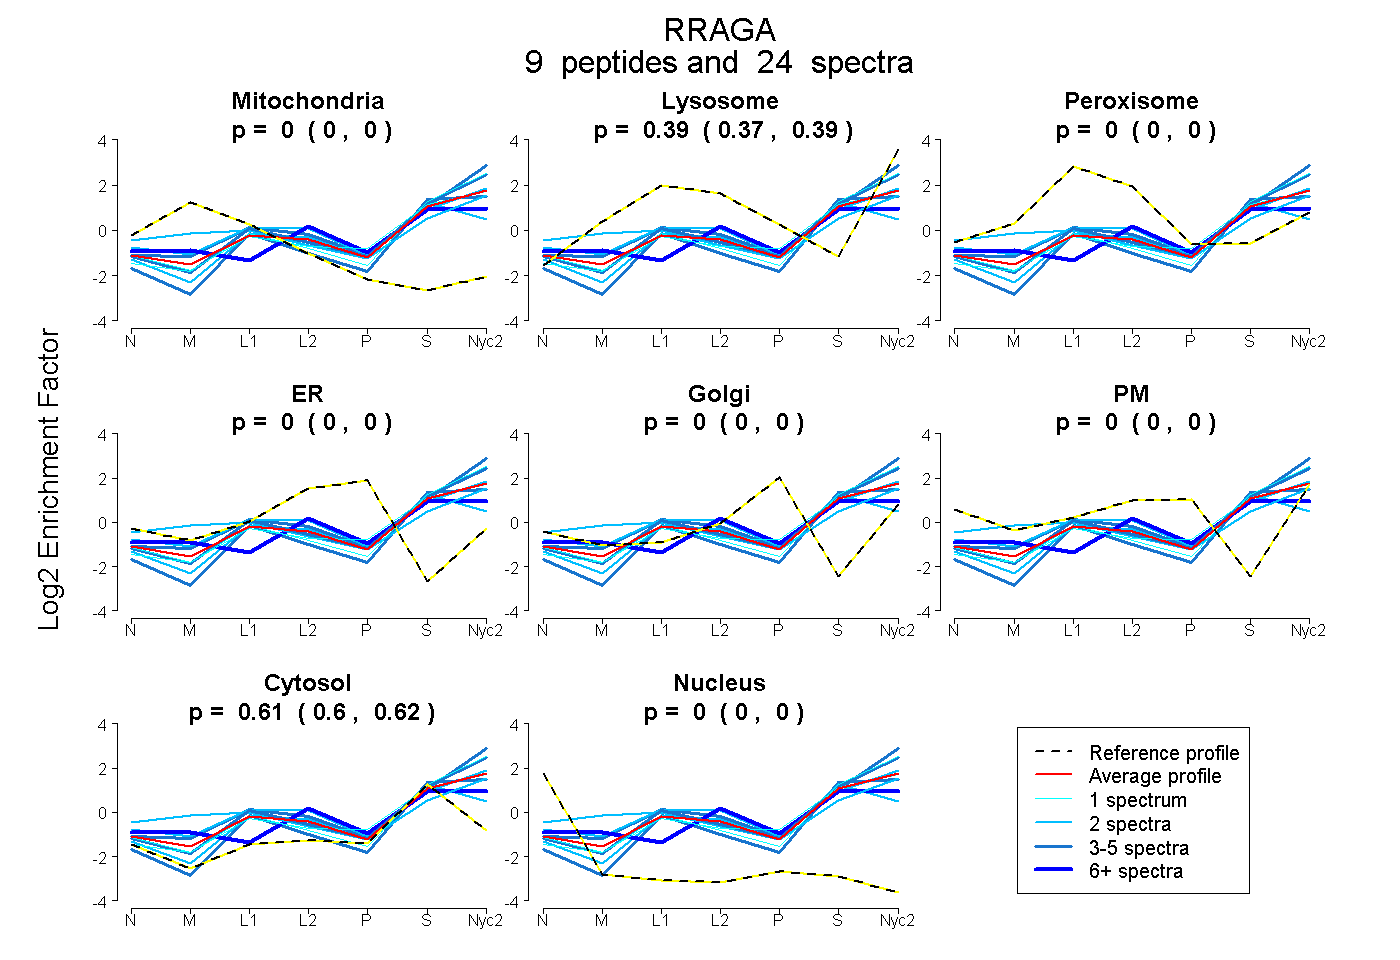 |
0.000
0.000 | 0.000 |
0.385
0.373 | 0.394 |
|
0.000
0.000 | 0.000 |
0.000
0.000 | 0.000 |
0.000
0.000 | 0.000 |
0.000
0.000 | 0.000 |
0.615
0.604 | 0.625 |
0.000
0.000 | 0.000 |
|
| | | Plot |
Mito |
|
Lyso or Perox |
|
ER |
Golgi |
PM |
Cytosol |
Nucleus |
|
| Expt B |
5
peptides |
8
spectra |
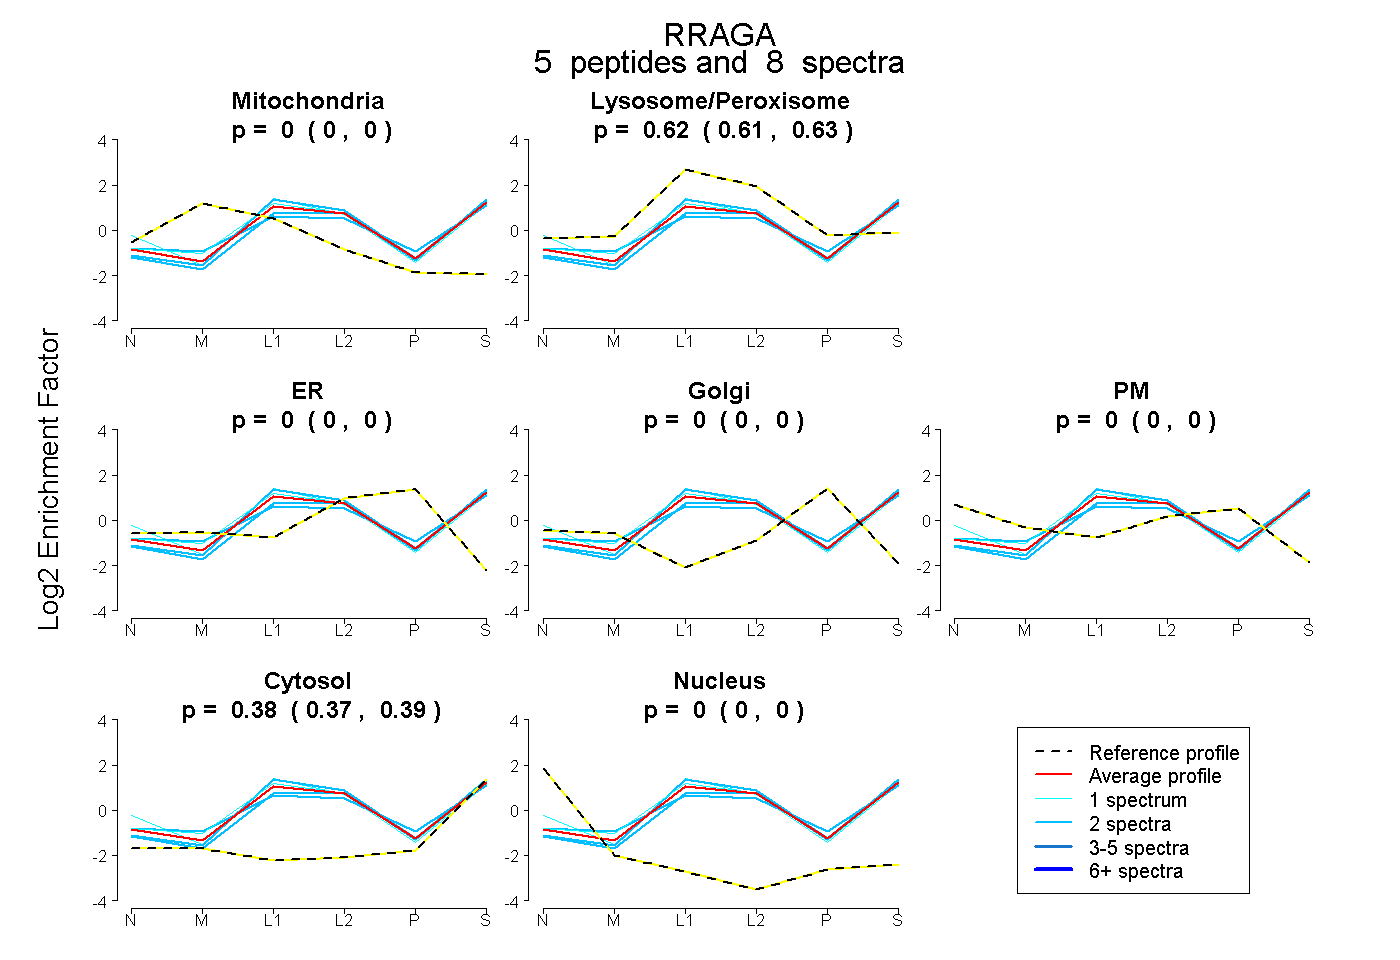 |
0.000
0.000 | 0.000 |
|
0.618
0.605 | 0.628 |
|
0.000
0.000 | 0.000 |
0.000
0.000 | 0.000 |
0.000
0.000 | 0.000 |
0.382
0.370 | 0.392 |
0.000
0.000 | 0.000 |
|
| 1 spectrum, LSRPLECACFR |
0.000 |
|
0.639 |
|
0.000 |
0.000 |
0.000 |
0.361 |
0.000 |
|
| 2 spectra, LGATIDVEHSHVR |
0.000 |
|
0.584 |
|
0.000 |
0.000 |
0.000 |
0.416 |
0.000 |
|
| 2 spectra, IFCLVHK |
0.000 |
|
0.645 |
|
0.000 |
0.000 |
0.000 |
0.355 |
0.000 |
|
| 2 spectra, SIIFANYIAR |
0.000 |
|
0.564 |
|
0.000 |
0.000 |
0.000 |
0.436 |
0.000 |
|
| 1 spectrum, ATFLVISHYQCK |
0.000 |
|
0.658 |
|
0.000 |
0.000 |
0.000 |
0.342 |
0.000 |
|
| | | Plot |
|
Lyso |
|
|
|
|
|
|
|
Other |
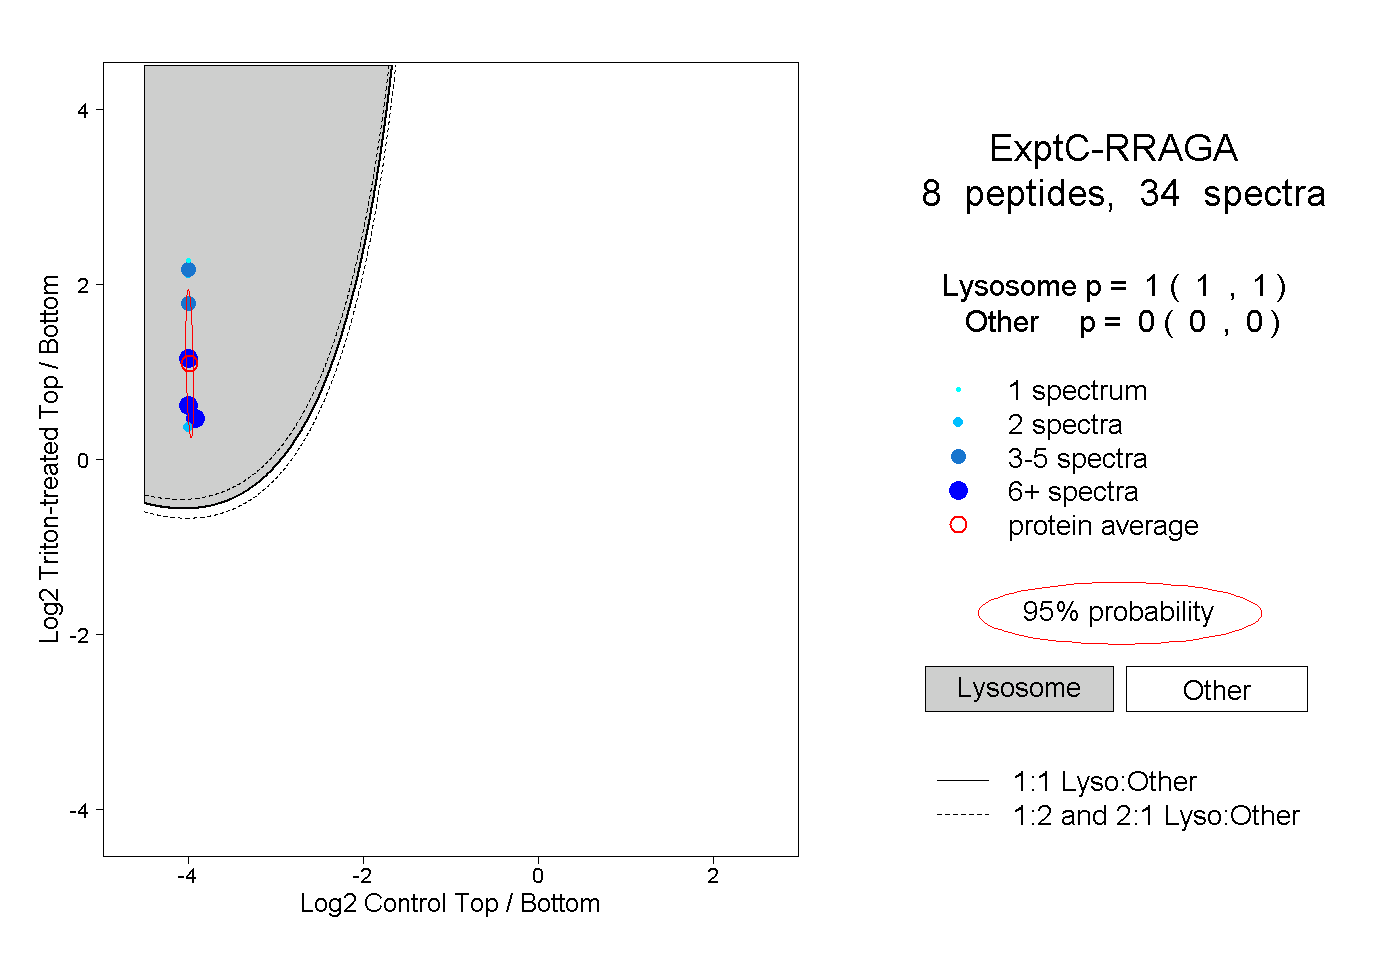
| Expt C |
8
peptides |
34
spectra |
 |
|
1.000
1.000 | 1.000 |
|
|
|
|
|
|
|
0.000
0.000 | 0.000 |