 9
9peptides
spectra
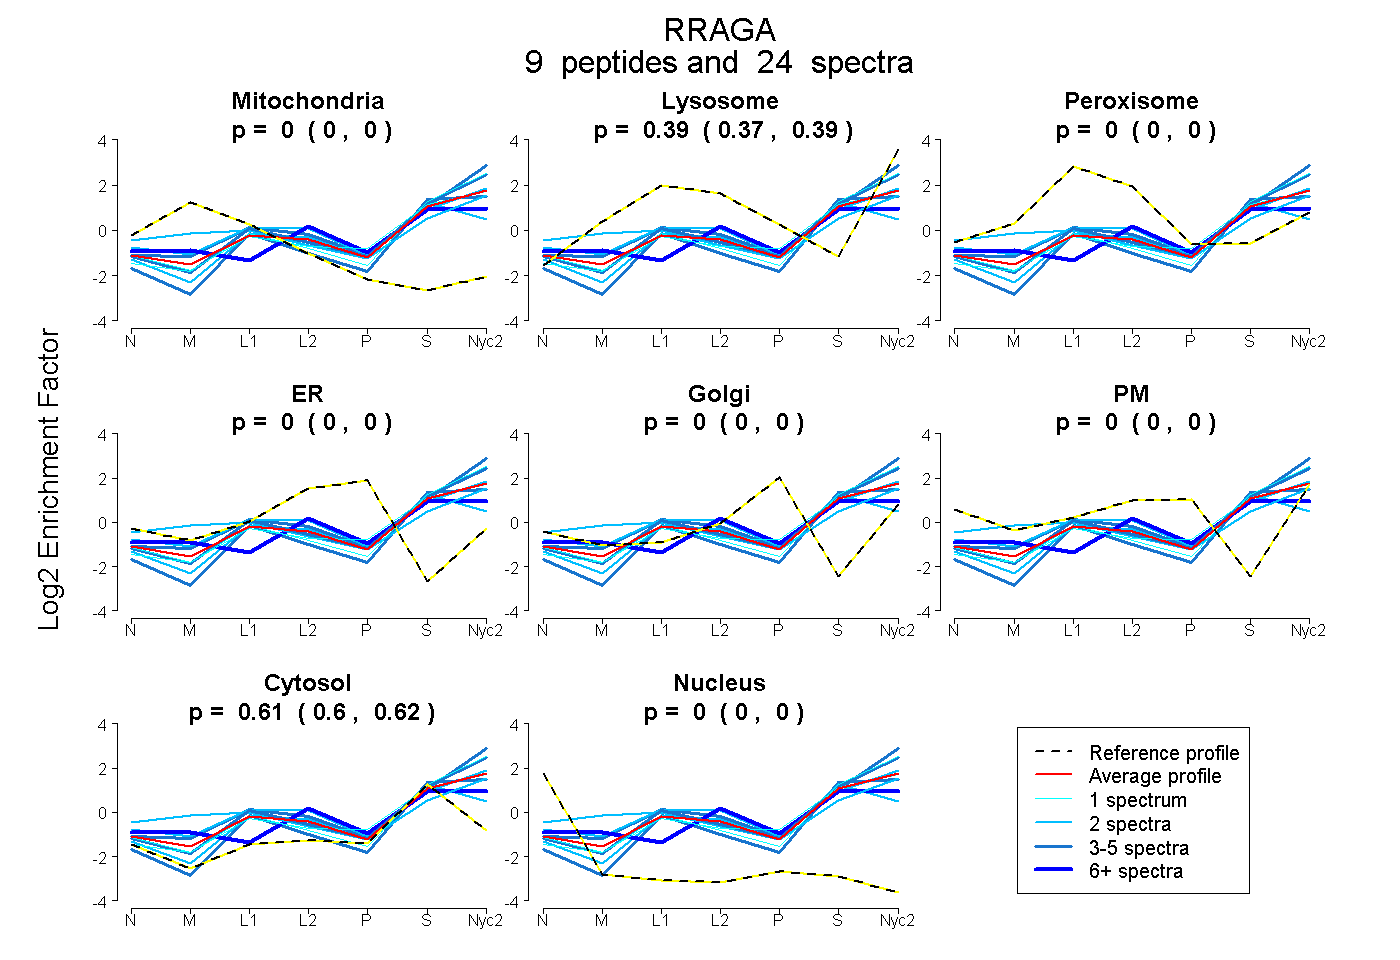
0.000 | 0.000
0.373 | 0.394
0.000 | 0.000
0.000 | 0.000
0.000 | 0.000
0.000 | 0.000
0.604 | 0.625
0.000 | 0.000
| Plot | Mito | Lyso | Perox | ER | Golgi | PM | Cytosol | Nucleus | |||||
| Expt A |
9 peptides |
24 spectra |
|
0.000 0.000 | 0.000 |
0.385 0.373 | 0.394 |
0.000 0.000 | 0.000 |
0.000 0.000 | 0.000 |
0.000 0.000 | 0.000 |
0.000 0.000 | 0.000 |
0.615 0.604 | 0.625 |
0.000 0.000 | 0.000 |
| 6 spectra, LSRPLECACFR | 0.000 | 0.276 | 0.000 | 0.000 | 0.000 | 0.070 | 0.654 | 0.000 | ||
| 4 spectra, LAASFQSMEVR | 0.000 | 0.527 | 0.000 | 0.000 | 0.000 | 0.000 | 0.473 | 0.000 | ||
| 2 spectra, MDLVQEDQR | 0.118 | 0.420 | 0.000 | 0.000 | 0.000 | 0.000 | 0.461 | 0.000 | ||
| 1 spectrum, TSIWDETLYK | 0.000 | 0.395 | 0.000 | 0.000 | 0.000 | 0.000 | 0.605 | 0.000 | ||
| 3 spectra, ATFLVISHYQCK | 0.000 | 0.239 | 0.000 | 0.000 | 0.000 | 0.000 | 0.761 | 0.000 | ||
| 2 spectra, LGATIDVEHSHVR | 0.000 | 0.470 | 0.000 | 0.000 | 0.000 | 0.000 | 0.530 | 0.000 | ||
| 2 spectra, IFCLVHK | 0.000 | 0.192 | 0.070 | 0.000 | 0.000 | 0.000 | 0.738 | 0.000 | ||
| 1 spectrum, VLLMGK | 0.000 | 0.358 | 0.000 | 0.000 | 0.000 | 0.000 | 0.642 | 0.000 | ||
| 3 spectra, SIIFANYIAR | 0.000 | 0.431 | 0.000 | 0.000 | 0.000 | 0.000 | 0.569 | 0.000 |
| Plot | Mito | Lyso or Perox | ER | Golgi | PM | Cytosol | Nucleus | ||||||
| Expt B |
5 peptides |
8 spectra |
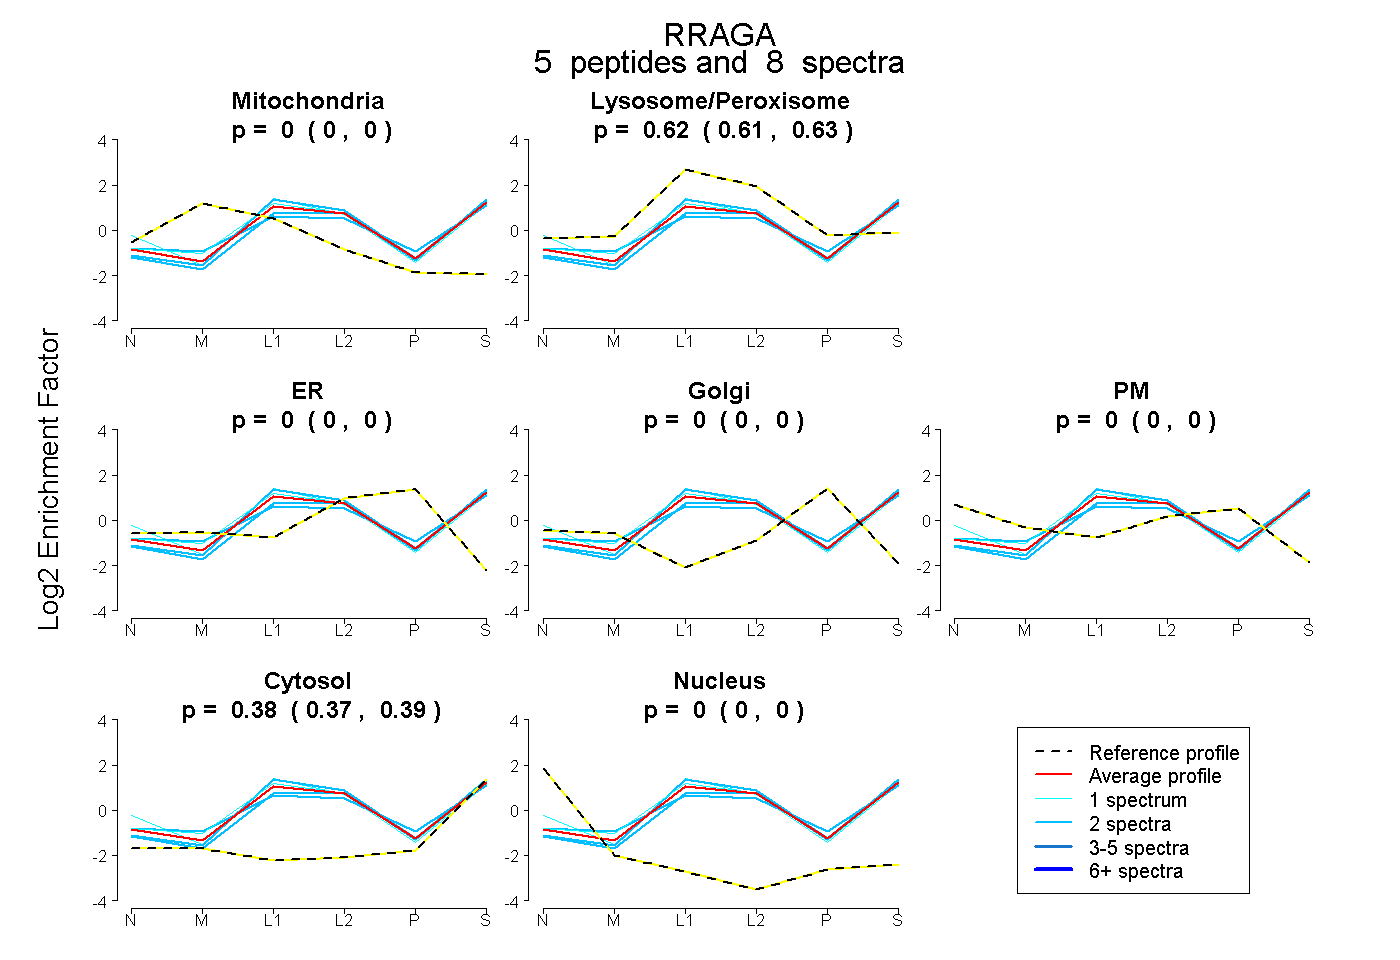 |
0.000 0.000 | 0.000 |
0.618 0.605 | 0.628 |
0.000 0.000 | 0.000 |
0.000 0.000 | 0.000 |
0.000 0.000 | 0.000 |
0.382 0.370 | 0.392 |
0.000 0.000 | 0.000 |
|||
| Plot | Lyso | Other | |||||||||||
| Expt C |
8 peptides |
34 spectra |
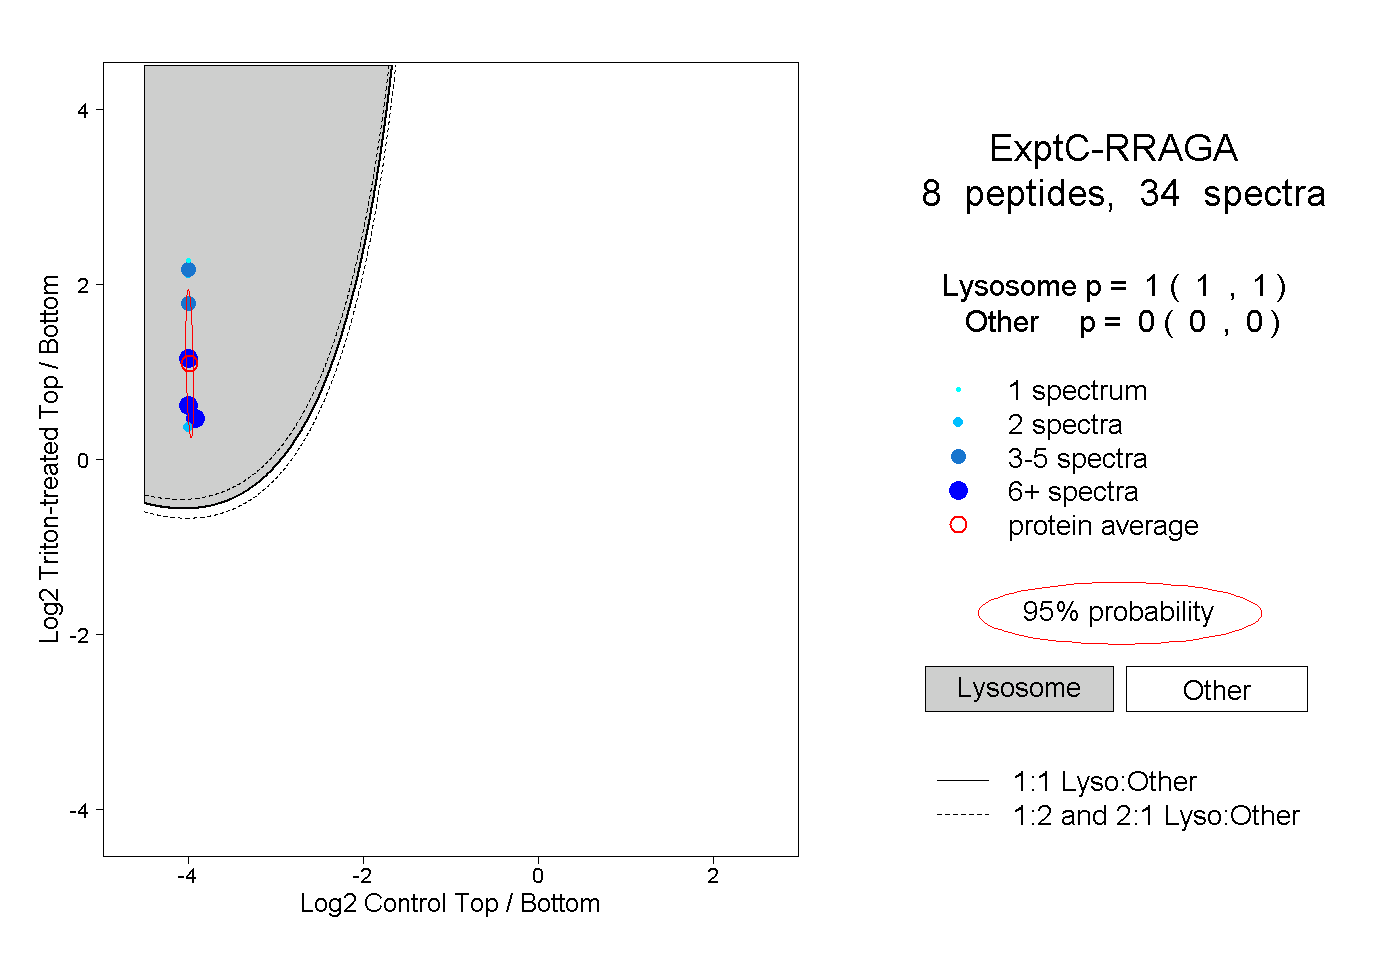 |
1.000 1.000 | 1.000 |
0.000 0.000 | 0.000 |