10
10peptides
spectra
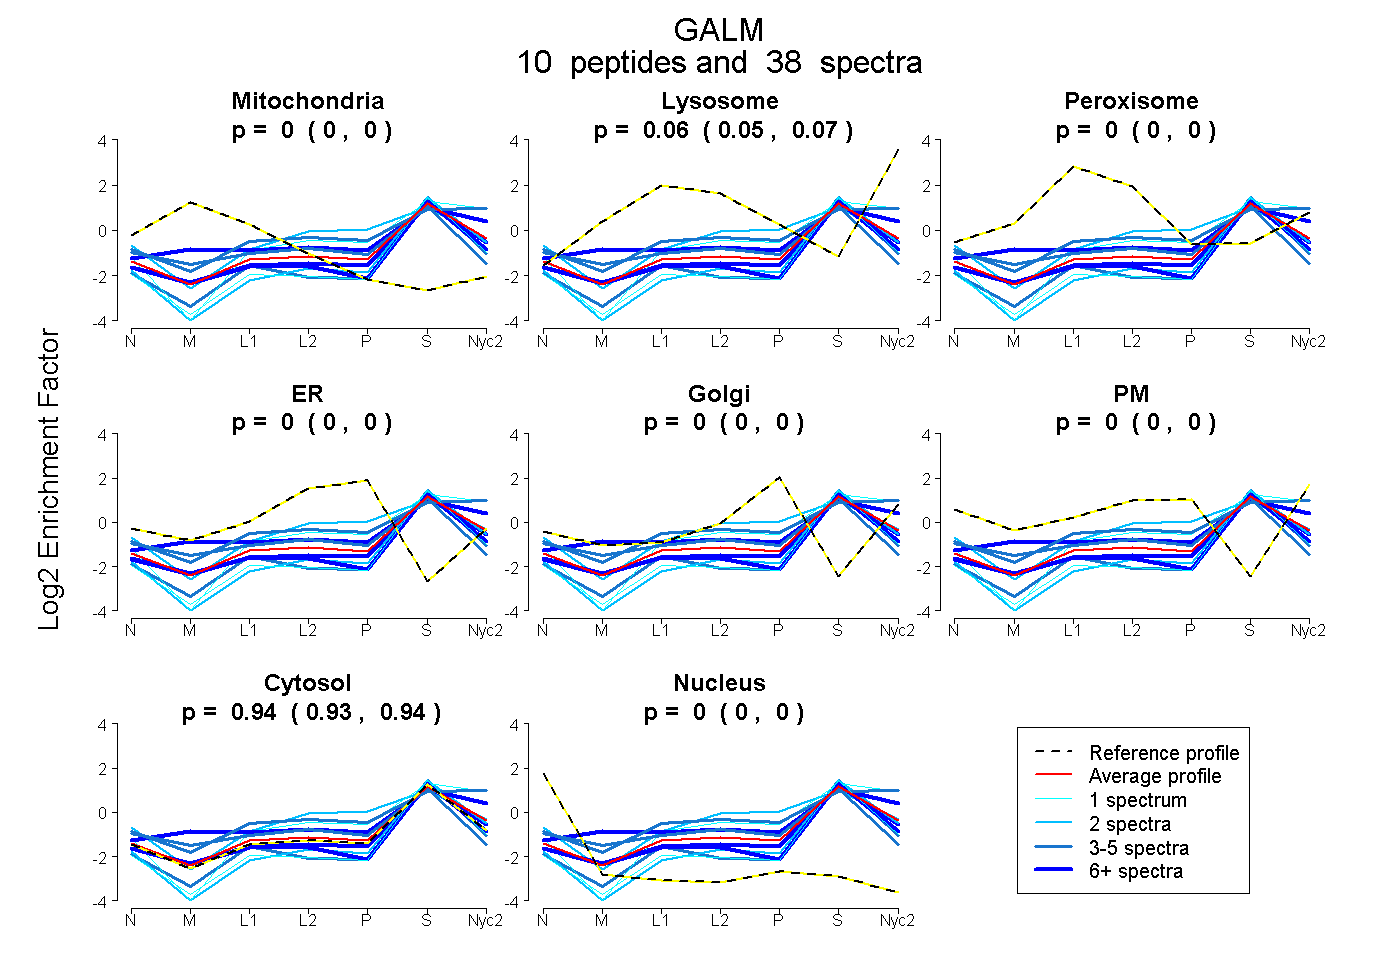
0.000 | 0.000
0.055 | 0.073
0.000 | 0.000
0.000 | 0.000
0.000 | 0.000
0.000 | 0.000
0.926 | 0.944
0.000 | 0.000
5peptides
spectra
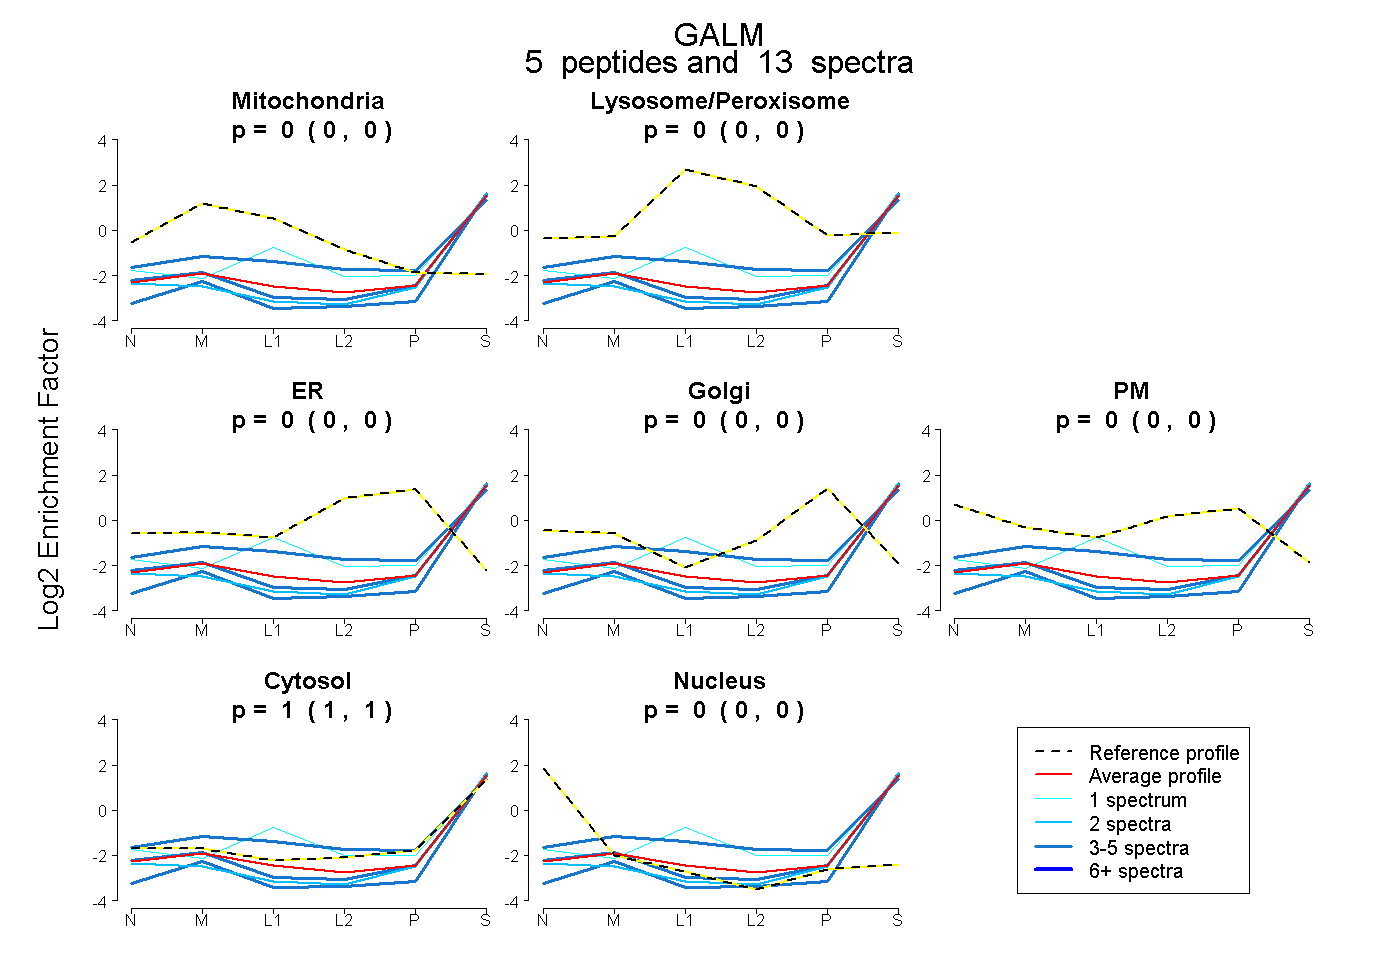
0.000 | 0.000
0.000 | 0.000
0.000 | 0.000
0.000 | 0.000
0.000 | 0.000
1.000 | 1.000
0.000 | 0.000