 10
10peptides
spectra
0.000 | 0.000
0.055 | 0.073
0.000 | 0.000
0.000 | 0.000
0.000 | 0.000
0.000 | 0.000
0.926 | 0.944
0.000 | 0.000
| Plot | Mito | Lyso | Perox | ER | Golgi | PM | Cytosol | Nucleus | |||||
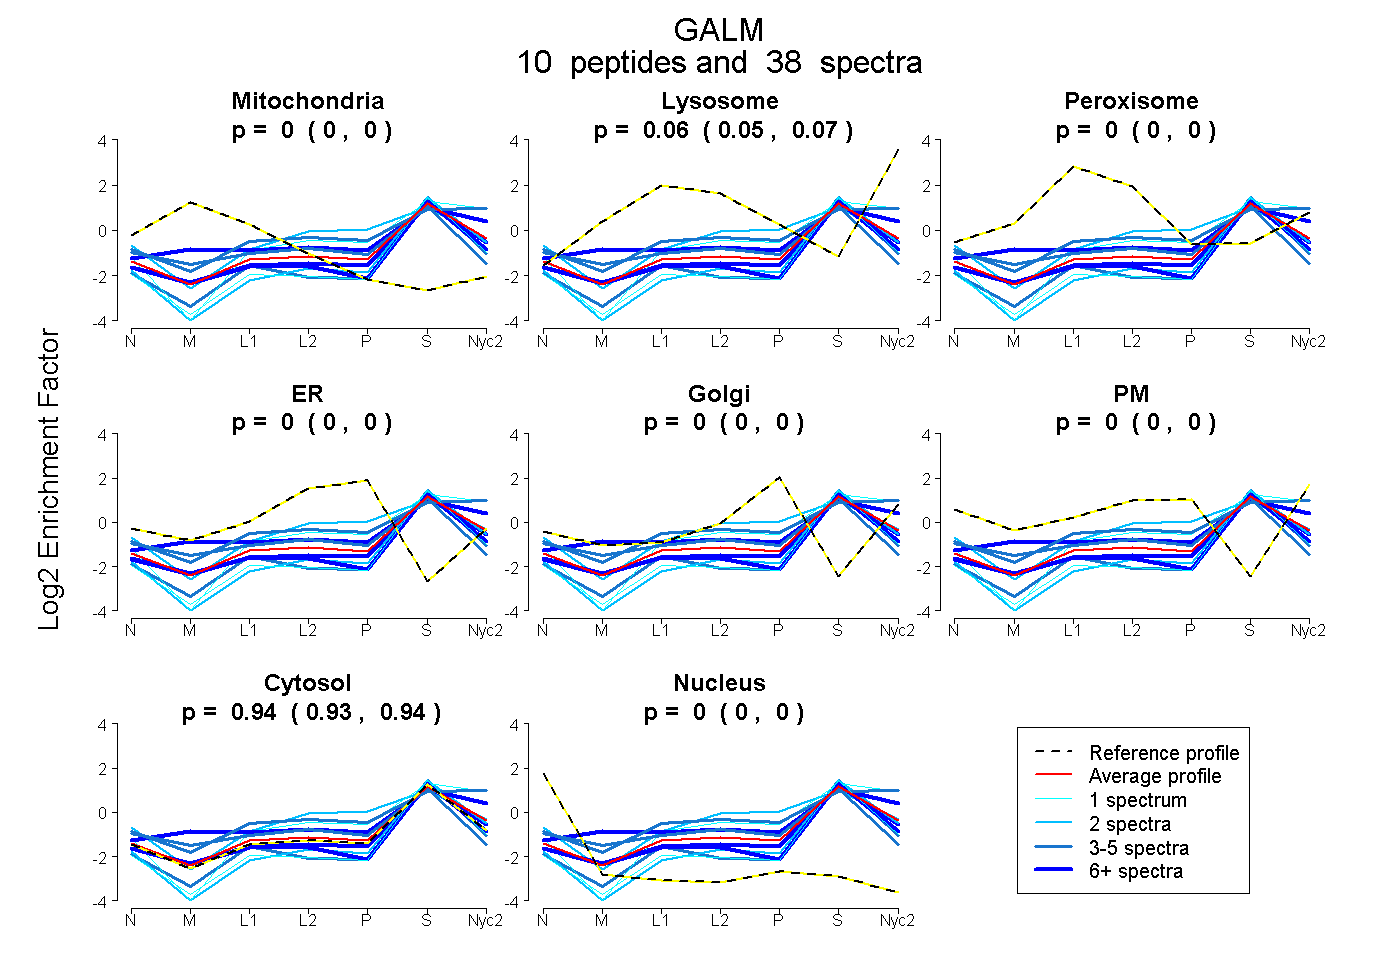
| Expt A |
10 peptides |
38 spectra |
|
0.000 0.000 | 0.000 |
0.064 0.055 | 0.073 |
0.000 0.000 | 0.000 |
0.000 0.000 | 0.000 |
0.000 0.000 | 0.000 |
0.000 0.000 | 0.000 |
0.936 0.926 | 0.944 |
0.000 0.000 | 0.000 |
| 1 spectrum, VWVTYTLDGGELVVNYR | 0.000 | 0.000 | 0.000 | 0.000 | 0.000 | 0.000 | 0.964 | 0.036 | ||
| 2 spectra, EPNSLHGGFR | 0.000 | 0.018 | 0.019 | 0.229 | 0.000 | 0.010 | 0.724 | 0.000 | ||
| 7 spectra, SGEVYPK | 0.046 | 0.251 | 0.000 | 0.000 | 0.000 | 0.000 | 0.703 | 0.000 | ||
| 1 spectrum, HLQSYHIHGFDHNFCLK | 0.000 | 0.161 | 0.000 | 0.000 | 0.000 | 0.000 | 0.839 | 0.000 | ||
| 3 spectra, VSPDGEEGYPGELK | 0.128 | 0.000 | 0.048 | 0.030 | 0.000 | 0.000 | 0.793 | 0.000 | ||
| 2 spectra, FTVDGK | 0.000 | 0.000 | 0.000 | 0.000 | 0.000 | 0.000 | 0.993 | 0.007 | ||
| 7 spectra, EYHLPINR | 0.000 | 0.015 | 0.000 | 0.000 | 0.000 | 0.000 | 0.985 | 0.000 | ||
| 9 spectra, QPYFGAVVGR | 0.007 | 0.000 | 0.000 | 0.000 | 0.000 | 0.000 | 0.975 | 0.018 | ||
| 3 spectra, TVFGELPSGGGAVEK | 0.000 | 0.271 | 0.000 | 0.000 | 0.000 | 0.071 | 0.657 | 0.000 | ||
| 3 spectra, ASDVVLGFAELEGYLQK | 0.000 | 0.000 | 0.000 | 0.000 | 0.000 | 0.000 | 0.972 | 0.028 |
| Plot | Mito | Lyso or Perox | ER | Golgi | PM | Cytosol | Nucleus | ||||||
| Expt B |
5 peptides |
13 spectra |
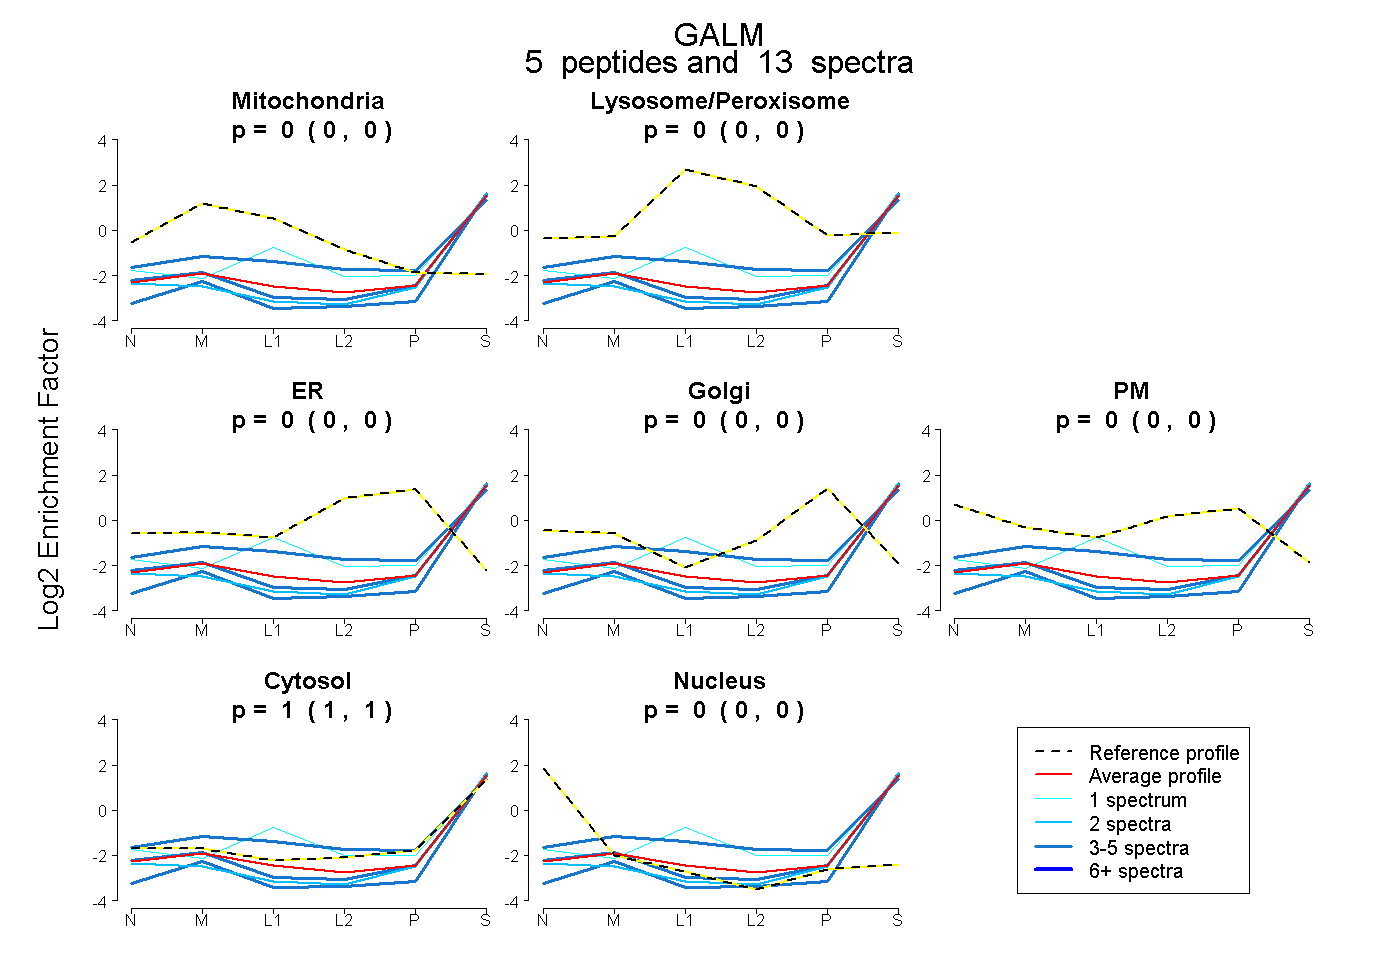 |
0.000 0.000 | 0.000 |
0.000 0.000 | 0.000 |
0.000 0.000 | 0.000 |
0.000 0.000 | 0.000 |
0.000 0.000 | 0.000 |
1.000 1.000 | 1.000 |
0.000 0.000 | 0.000 |
|||
| Plot | Lyso | Other | |||||||||||
| Expt C |
11 peptides |
41 spectra |
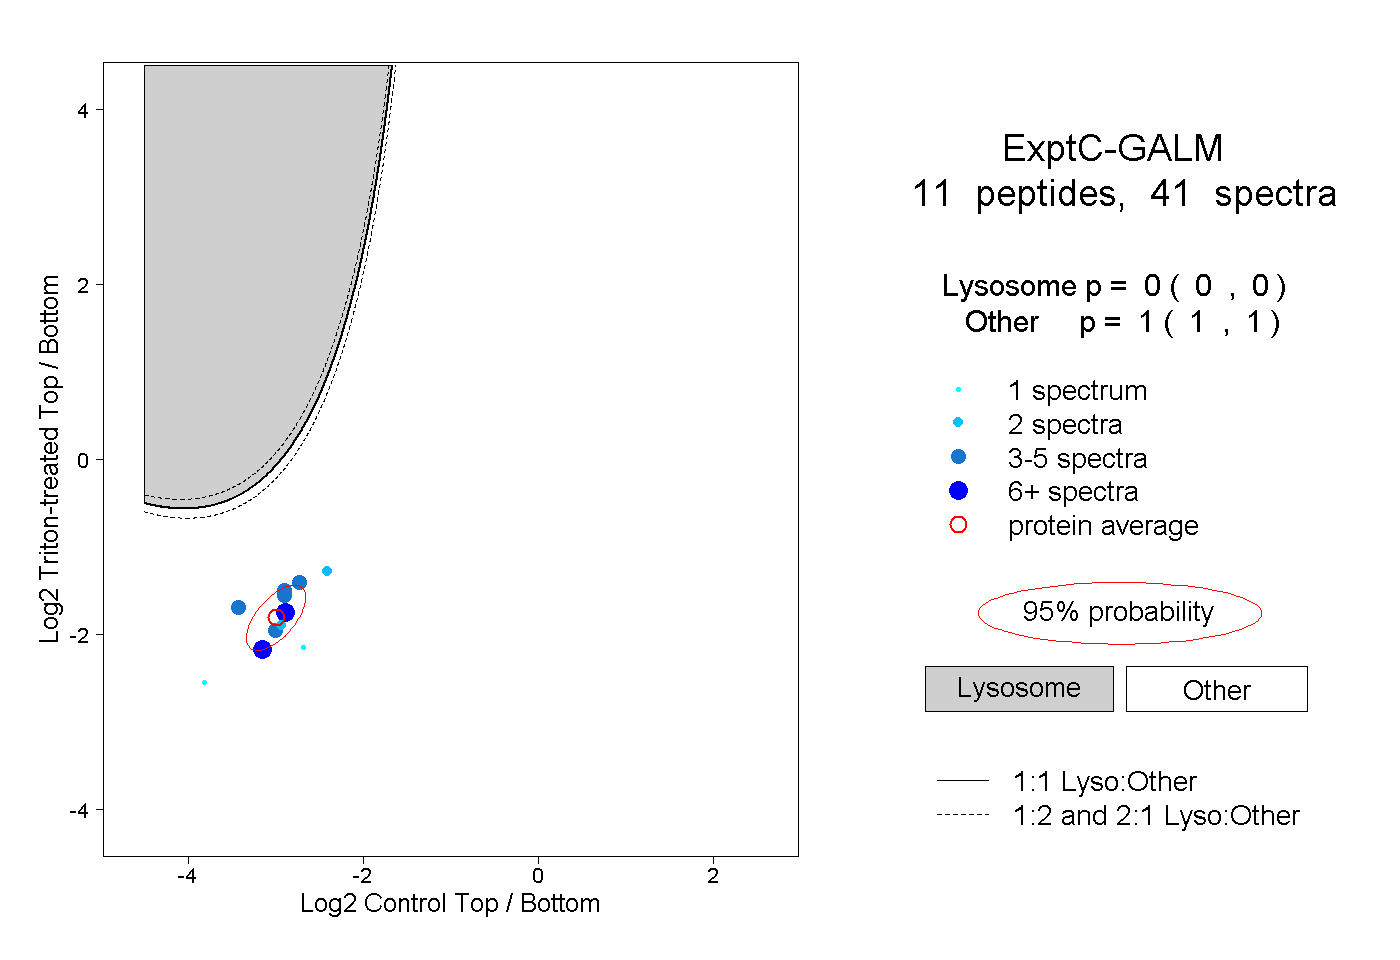 |
0.000 0.000 | 0.000 |
1.000 1.000 | 1.000 |
||||||||
| Plot | Lyso | Other | |||||||||||
| Expt D |
3 peptides |
3 spectra |
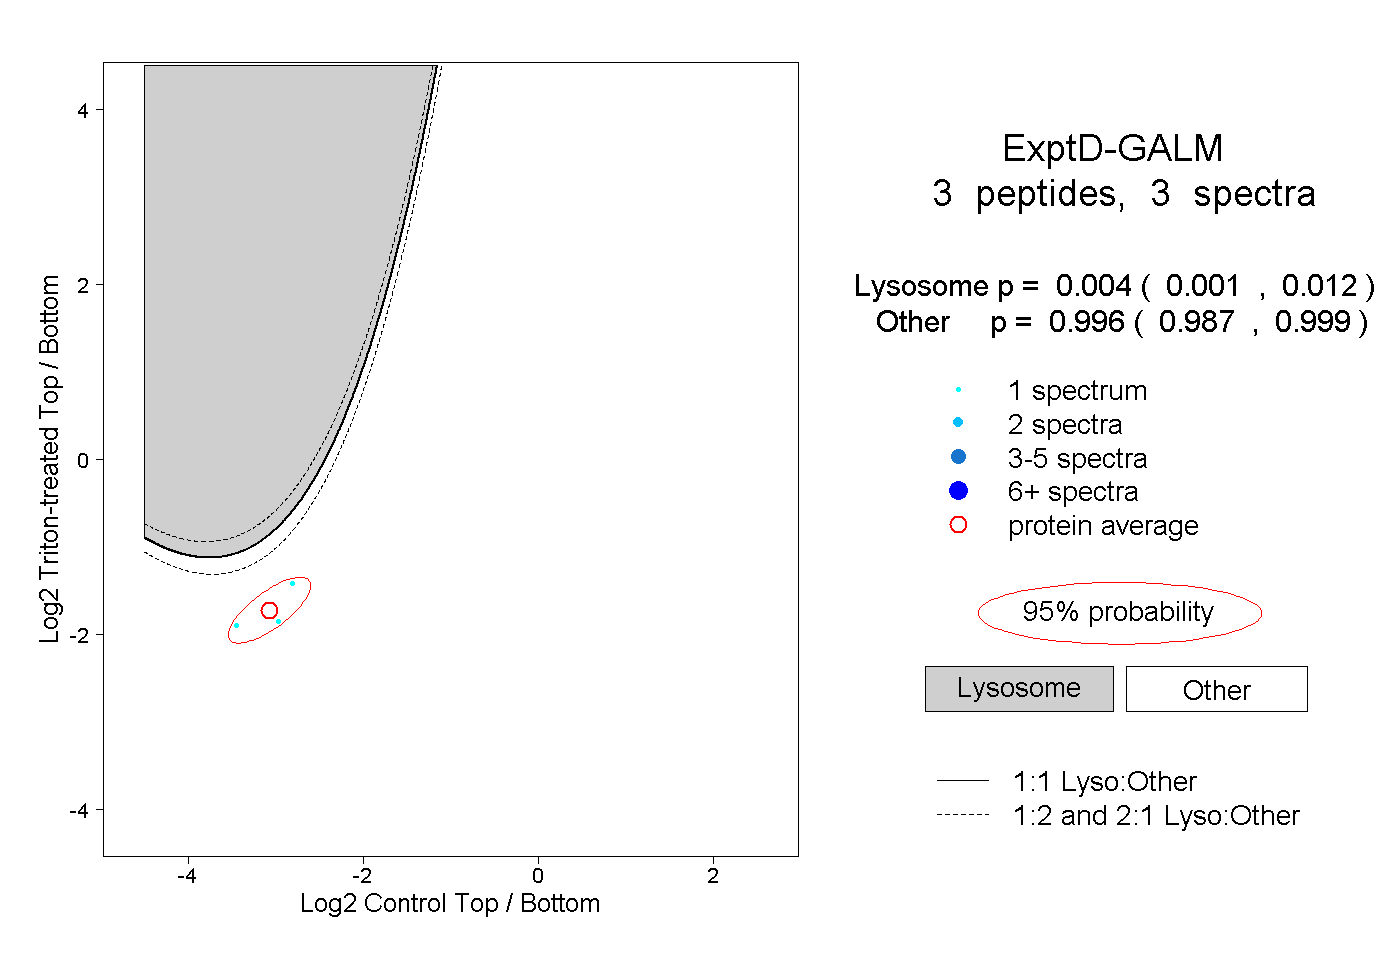 |
0.004 0.001 | 0.012 |
0.996 0.987 | 0.999 |