 9
9peptides
spectra
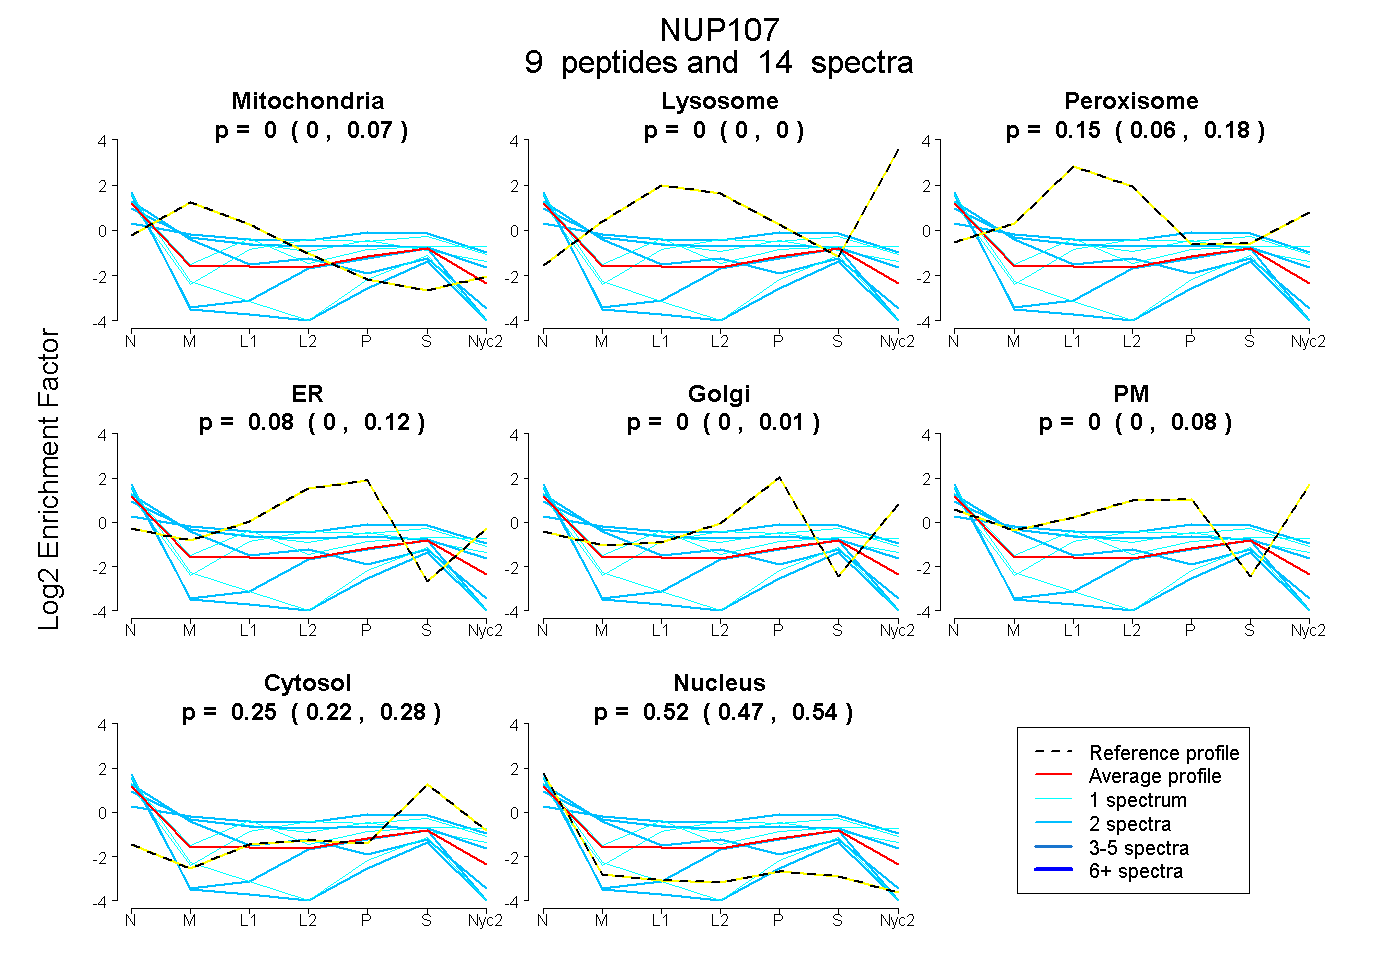
0.000 | 0.070
0.000 | 0.000
0.056 | 0.185
0.002 | 0.117
0.000 | 0.011
0.000 | 0.082
0.219 | 0.282
0.467 | 0.535
| Plot | Mito | Lyso | Perox | ER | Golgi | PM | Cytosol | Nucleus | |||||
| Expt A |
9 peptides |
14 spectra |
|
0.000 0.000 | 0.070 |
0.000 0.000 | 0.000 |
0.150 0.056 | 0.185 |
0.083 0.002 | 0.117 |
0.000 0.000 | 0.011 |
0.000 0.000 | 0.082 |
0.246 0.219 | 0.282 |
0.521 0.467 | 0.535 |
| 2 spectra, HPDISYIFGTEGR | 0.210 | 0.000 | 0.175 | 0.108 | 0.000 | 0.074 | 0.187 | 0.247 | ||
| 2 spectra, AHQMVLLR | 0.256 | 0.000 | 0.052 | 0.133 | 0.000 | 0.164 | 0.395 | 0.000 | ||
| 1 spectrum, VFEELQATDK | 0.000 | 0.000 | 0.000 | 0.000 | 0.000 | 0.000 | 0.139 | 0.861 | ||
| 1 spectrum, GHLDALTADVK | 0.000 | 0.000 | 0.090 | 0.084 | 0.000 | 0.192 | 0.378 | 0.256 | ||
| 1 spectrum, EADLDVATITK | 0.229 | 0.000 | 0.101 | 0.048 | 0.000 | 0.211 | 0.197 | 0.214 | ||
| 2 spectra, TVVEALFQR | 0.000 | 0.000 | 0.000 | 0.000 | 0.000 | 0.000 | 0.065 | 0.935 | ||
| 1 spectrum, HQCLELAK | 0.000 | 0.000 | 0.206 | 0.000 | 0.000 | 0.217 | 0.229 | 0.348 | ||
| 2 spectra, AGMTEEAQR | 0.396 | 0.000 | 0.056 | 0.000 | 0.000 | 0.000 | 0.109 | 0.439 | ||
| 2 spectra, VAHEHK | 0.000 | 0.000 | 0.000 | 0.021 | 0.000 | 0.000 | 0.278 | 0.701 |
| Plot | Mito | Lyso or Perox | ER | Golgi | PM | Cytosol | Nucleus | ||||||
| Expt B |
1 peptide |
1 spectrum |
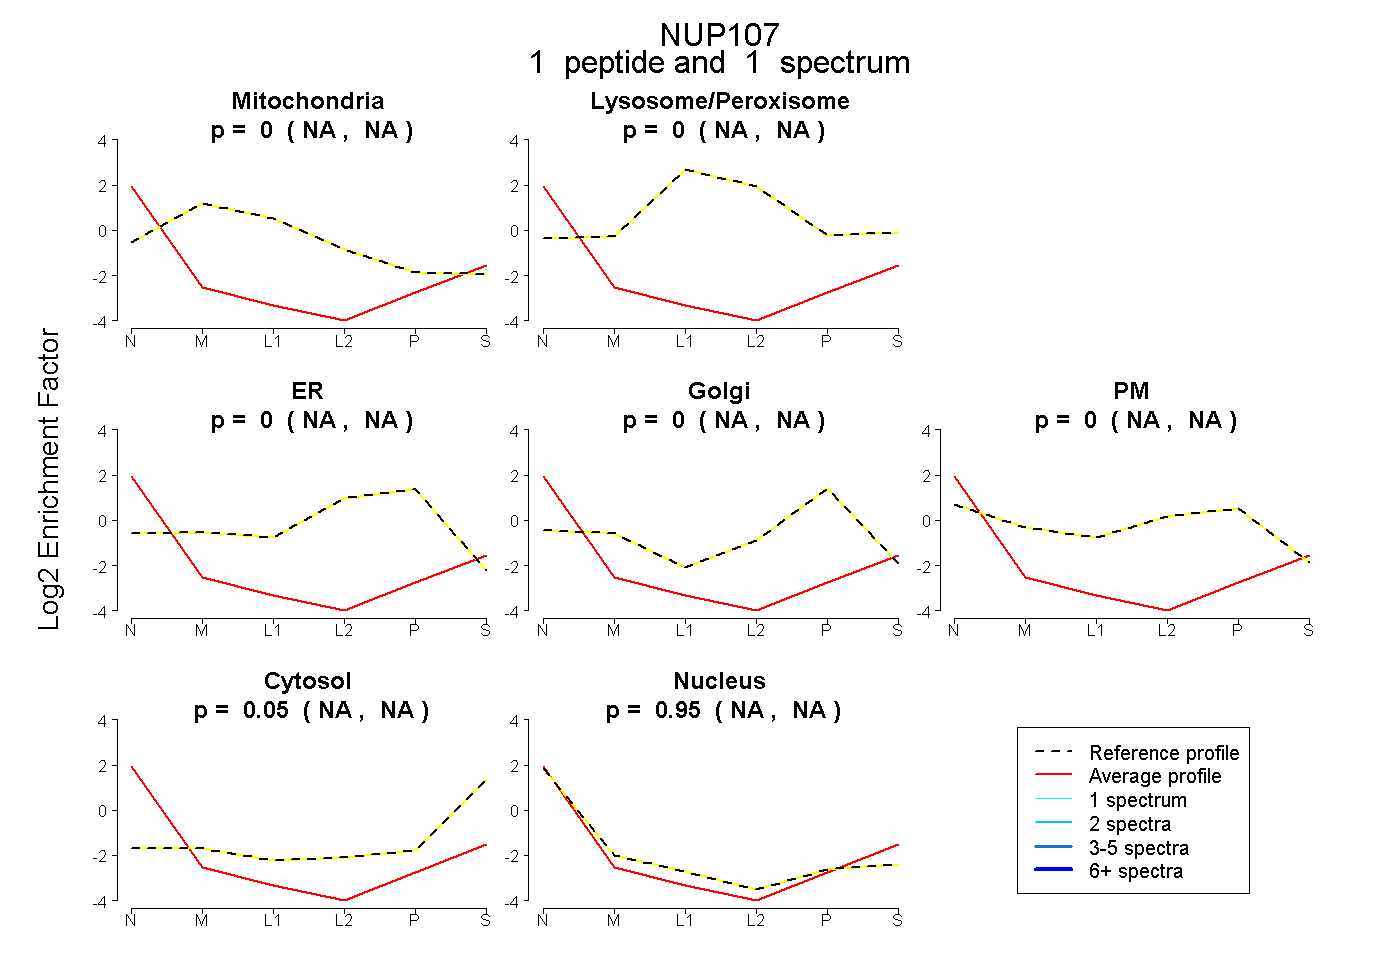 |
0.000 NA | NA |
0.000 NA | NA |
0.000 NA | NA |
0.000 NA | NA |
0.000 NA | NA |
0.052 NA | NA |
0.948 NA | NA |