17
17peptides
spectra
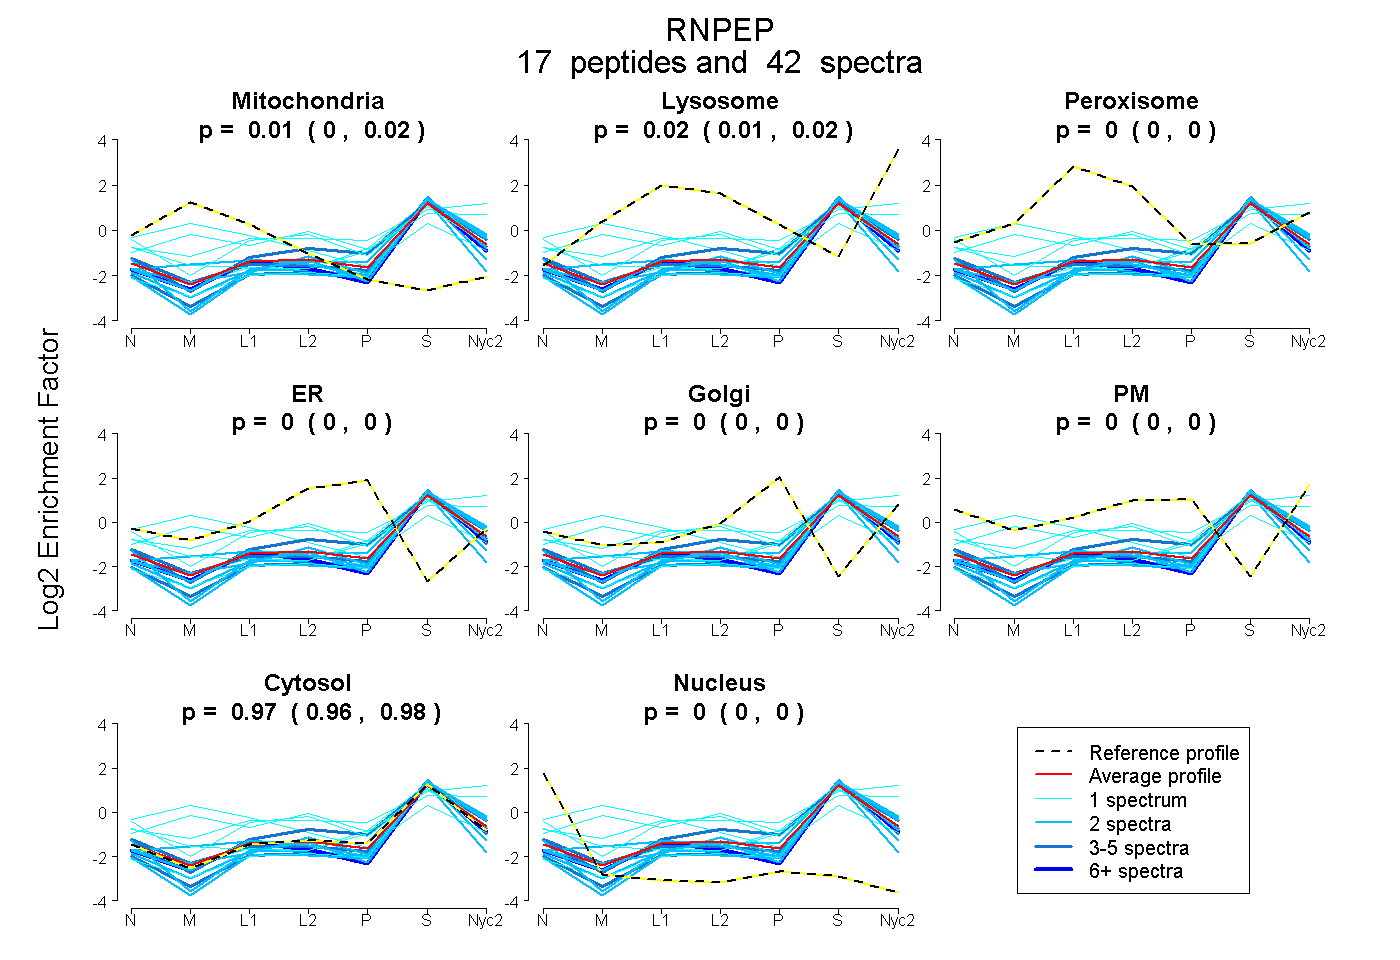
0.004 | 0.019
0.011 | 0.022
0.000 | 0.000
0.000 | 0.000
0.000 | 0.000
0.000 | 0.000
0.963 | 0.978
0.000 | 0.000
9peptides
spectra
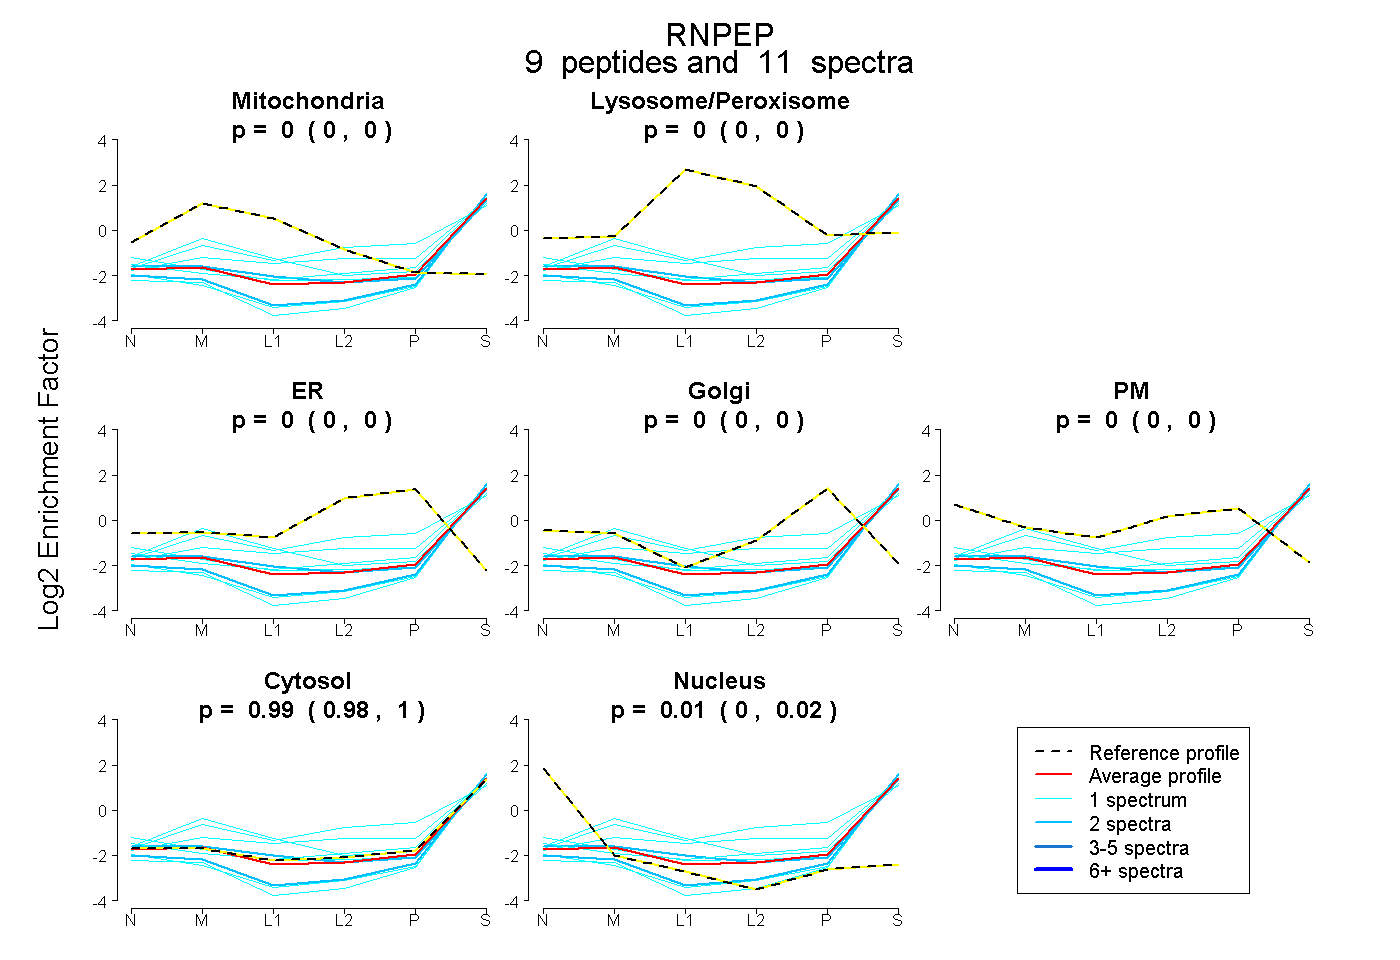
0.000 | 0.000
0.000 | 0.000
0.000 | 0.000
0.000 | 0.000
0.000 | 0.000
0.977 | 1.000
0.000 | 0.021