 17
17peptides
spectra
0.004 | 0.019
0.011 | 0.022
0.000 | 0.000
0.000 | 0.000
0.000 | 0.000
0.000 | 0.000
0.963 | 0.978
0.000 | 0.000
| Plot | Mito | Lyso | Perox | ER | Golgi | PM | Cytosol | Nucleus | |||||
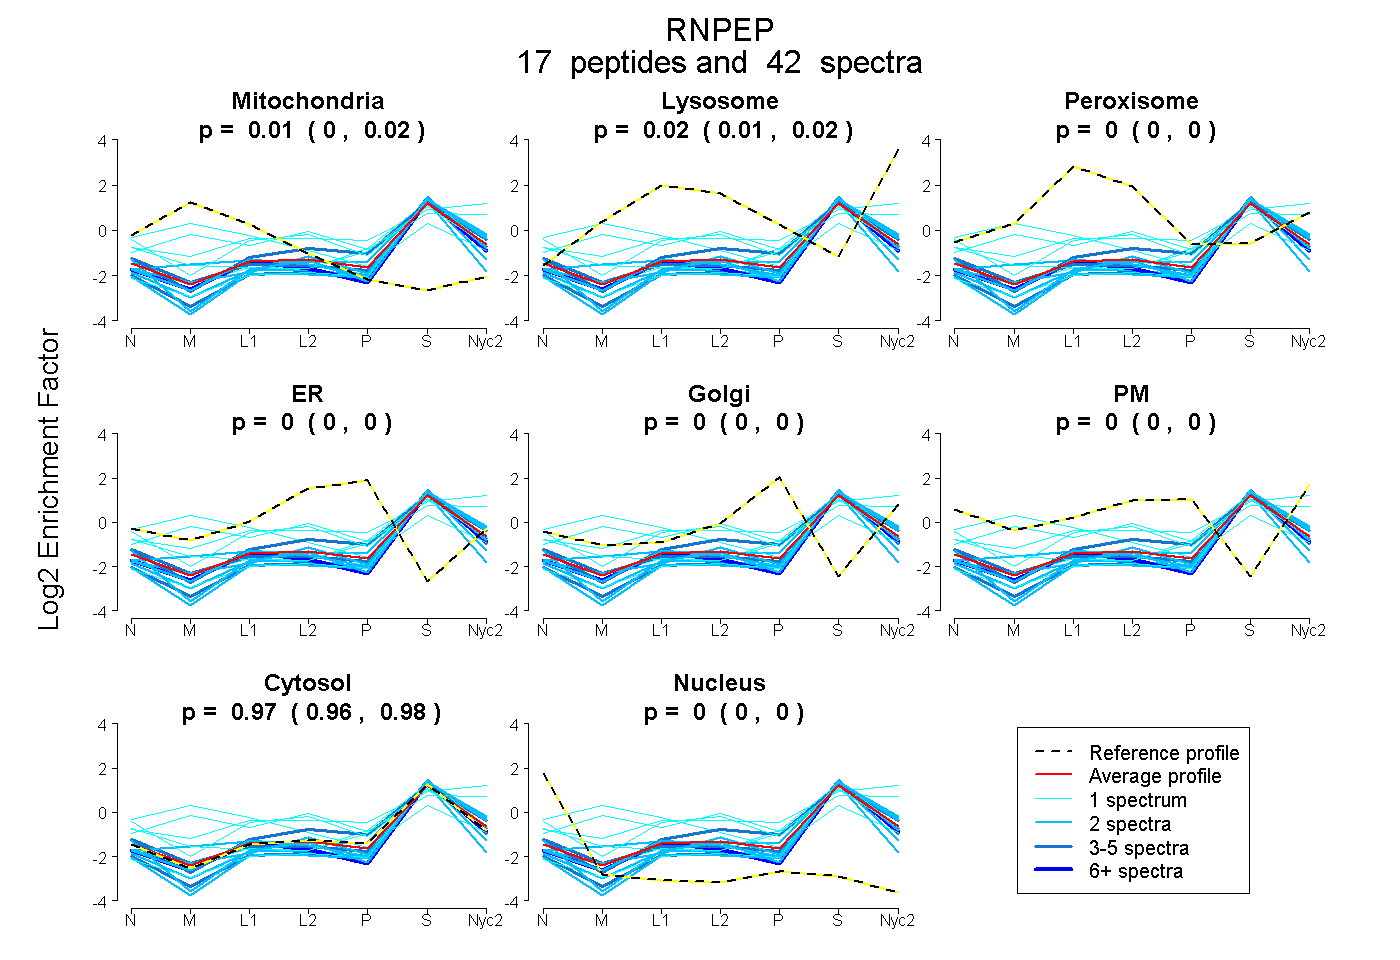
| Expt A |
17 peptides |
42 spectra |
|
0.012 0.004 | 0.019 |
0.017 0.011 | 0.022 |
0.000 0.000 | 0.000 |
0.000 0.000 | 0.000 |
0.000 0.000 | 0.000 |
0.000 0.000 | 0.000 |
0.971 0.963 | 0.978 |
0.000 0.000 | 0.000 |
| 1 spectrum, VWAEPCLIEAAK | 0.000 | 0.000 | 0.000 | 0.000 | 0.000 | 0.000 | 1.000 | 0.000 | ||
| 1 spectrum, LGETYPK | 0.000 | 0.336 | 0.000 | 0.000 | 0.000 | 0.059 | 0.605 | 0.000 | ||
| 1 spectrum, SPLPPGNVK | 0.000 | 0.000 | 0.260 | 0.000 | 0.000 | 0.001 | 0.699 | 0.039 | ||
| 2 spectra, LDSHSCLEVMAATLLR | 0.135 | 0.000 | 0.000 | 0.000 | 0.000 | 0.000 | 0.865 | 0.000 | ||
| 1 spectrum, MESSGPSSCHSAAR | 0.392 | 0.000 | 0.166 | 0.000 | 0.000 | 0.000 | 0.443 | 0.000 | ||
| 5 spectra, GVDSIPGFEFNR | 0.018 | 0.000 | 0.000 | 0.000 | 0.000 | 0.000 | 0.959 | 0.023 | ||
| 2 spectra, TYQLVYFLDK | 0.000 | 0.012 | 0.000 | 0.000 | 0.000 | 0.000 | 0.988 | 0.000 | ||
| 1 spectrum, QHMDVSGEENPLNK | 0.102 | 0.353 | 0.000 | 0.000 | 0.000 | 0.000 | 0.545 | 0.000 | ||
| 2 spectra, ISNAQNAELR | 0.000 | 0.026 | 0.000 | 0.000 | 0.000 | 0.000 | 0.974 | 0.000 | ||
| 1 spectrum, VGEGPGVCWLAPEQTAGK | 0.066 | 0.000 | 0.000 | 0.000 | 0.082 | 0.000 | 0.829 | 0.023 | ||
| 2 spectra, AFFPCFDTPAVK | 0.000 | 0.000 | 0.000 | 0.000 | 0.000 | 0.000 | 0.963 | 0.037 | ||
| 1 spectrum, ATLELR | 0.000 | 0.000 | 0.000 | 0.000 | 0.031 | 0.000 | 0.969 | 0.000 | ||
| 2 spectra, WGQIILK | 0.000 | 0.000 | 0.000 | 0.000 | 0.000 | 0.000 | 0.985 | 0.015 | ||
| 10 spectra, AYVDEFK | 0.000 | 0.000 | 0.000 | 0.000 | 0.000 | 0.000 | 0.985 | 0.015 | ||
| 3 spectra, AEFGPPGPGPGSR | 0.000 | 0.000 | 0.000 | 0.000 | 0.000 | 0.000 | 0.986 | 0.014 | ||
| 2 spectra, LELTYR | 0.000 | 0.000 | 0.000 | 0.000 | 0.000 | 0.000 | 0.989 | 0.011 | ||
| 5 spectra, NDHQEEFWK | 0.000 | 0.056 | 0.000 | 0.020 | 0.000 | 0.011 | 0.913 | 0.000 |
| Plot | Mito | Lyso or Perox | ER | Golgi | PM | Cytosol | Nucleus | ||||||
| Expt B |
9 peptides |
11 spectra |
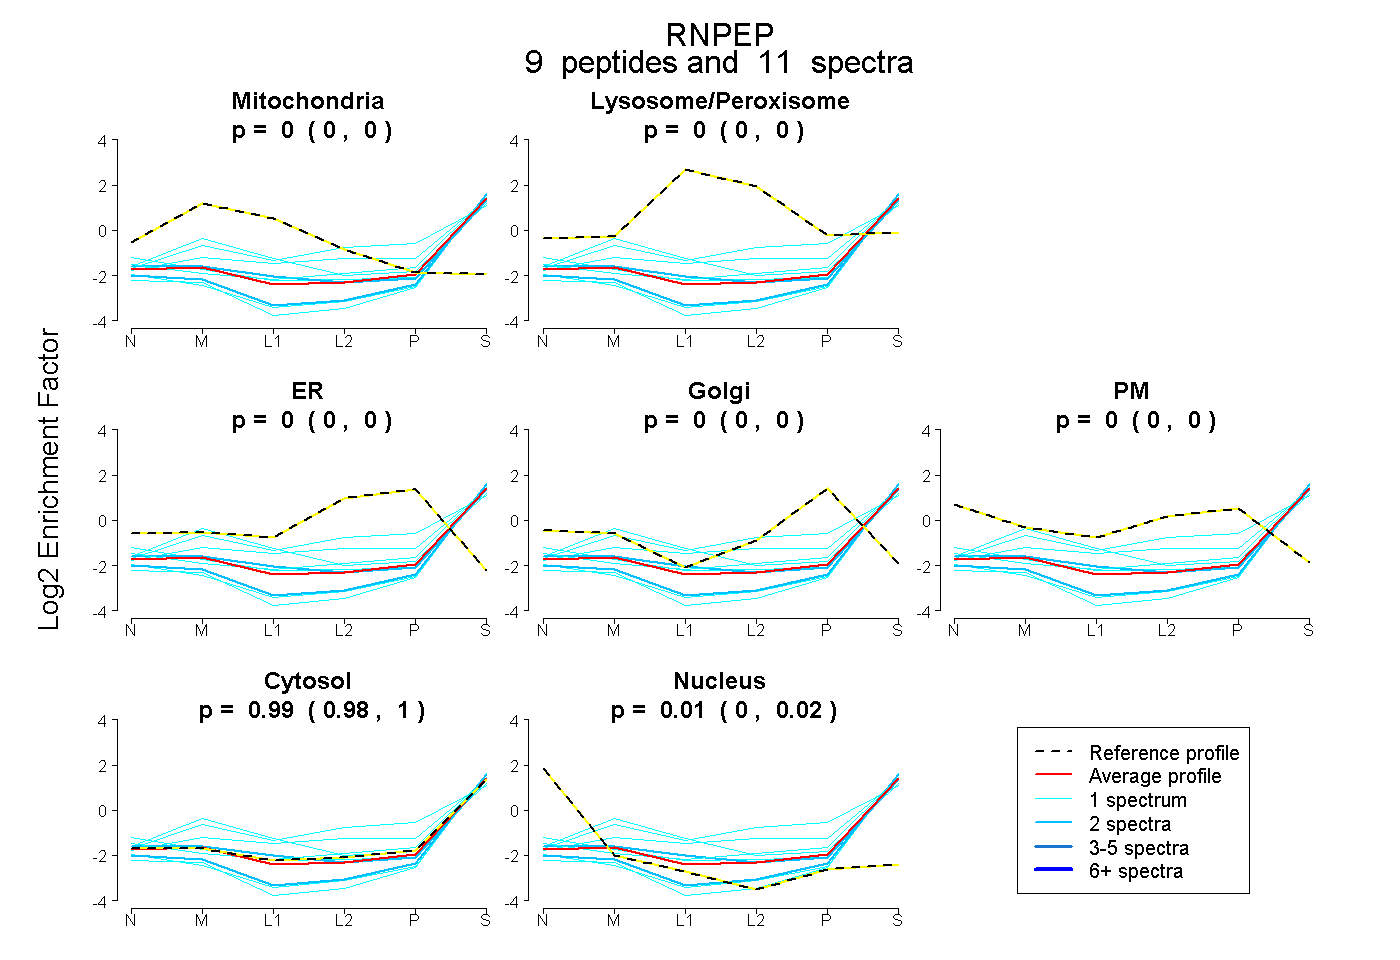 |
0.000 0.000 | 0.000 |
0.000 0.000 | 0.000 |
0.000 0.000 | 0.000 |
0.000 0.000 | 0.000 |
0.000 0.000 | 0.000 |
0.991 0.977 | 1.000 |
0.009 0.000 | 0.021 |
|||
| Plot | Lyso | Other | |||||||||||
| Expt C |
12 peptides |
40 spectra |
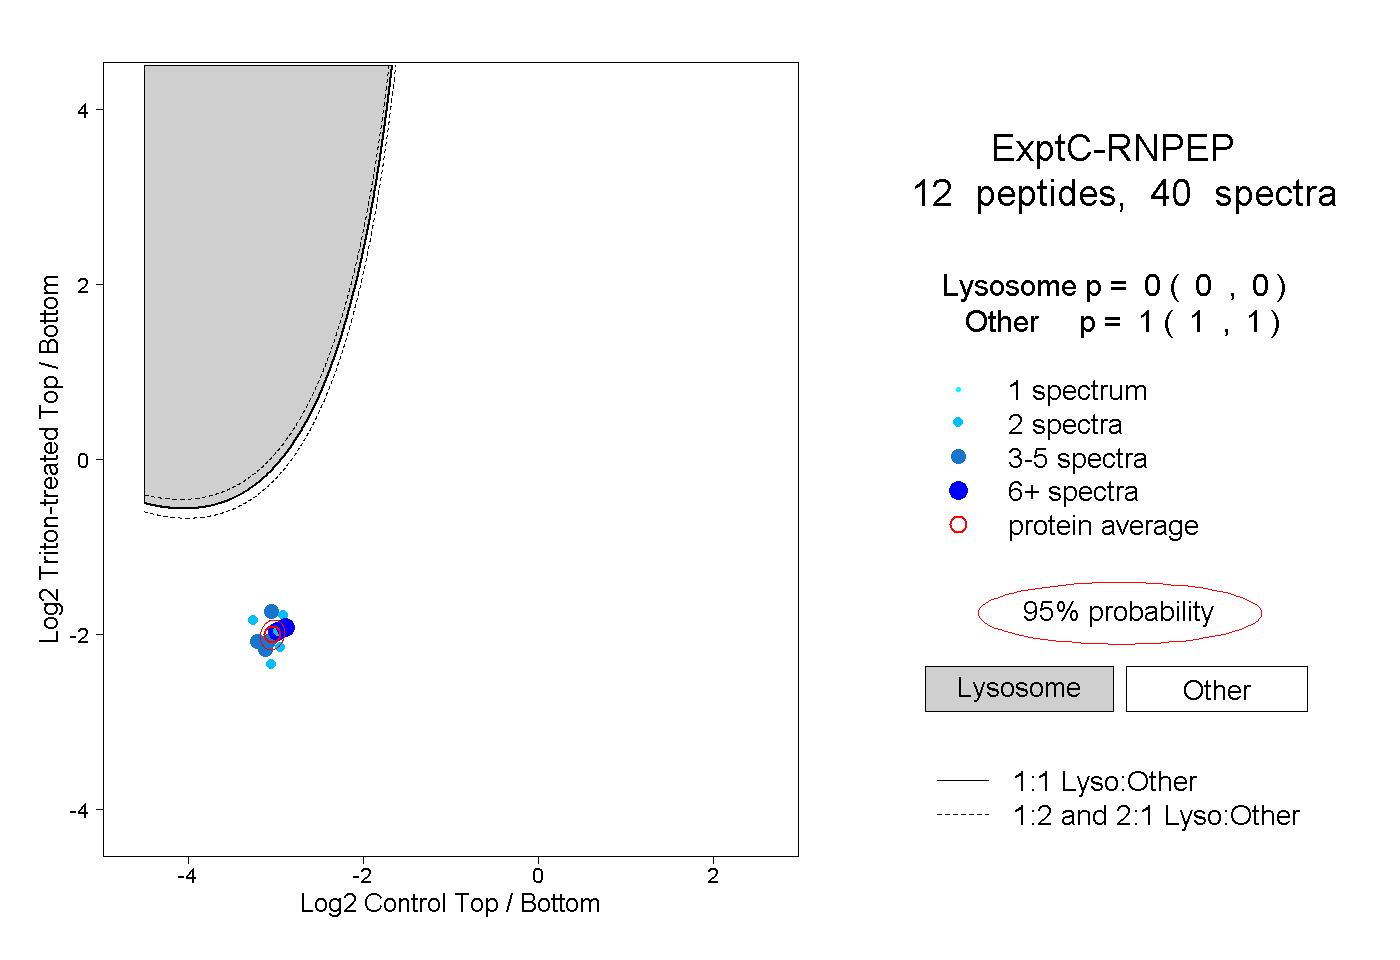 |
0.000 0.000 | 0.000 |
1.000 1.000 | 1.000 |