 3
3peptides
spectra
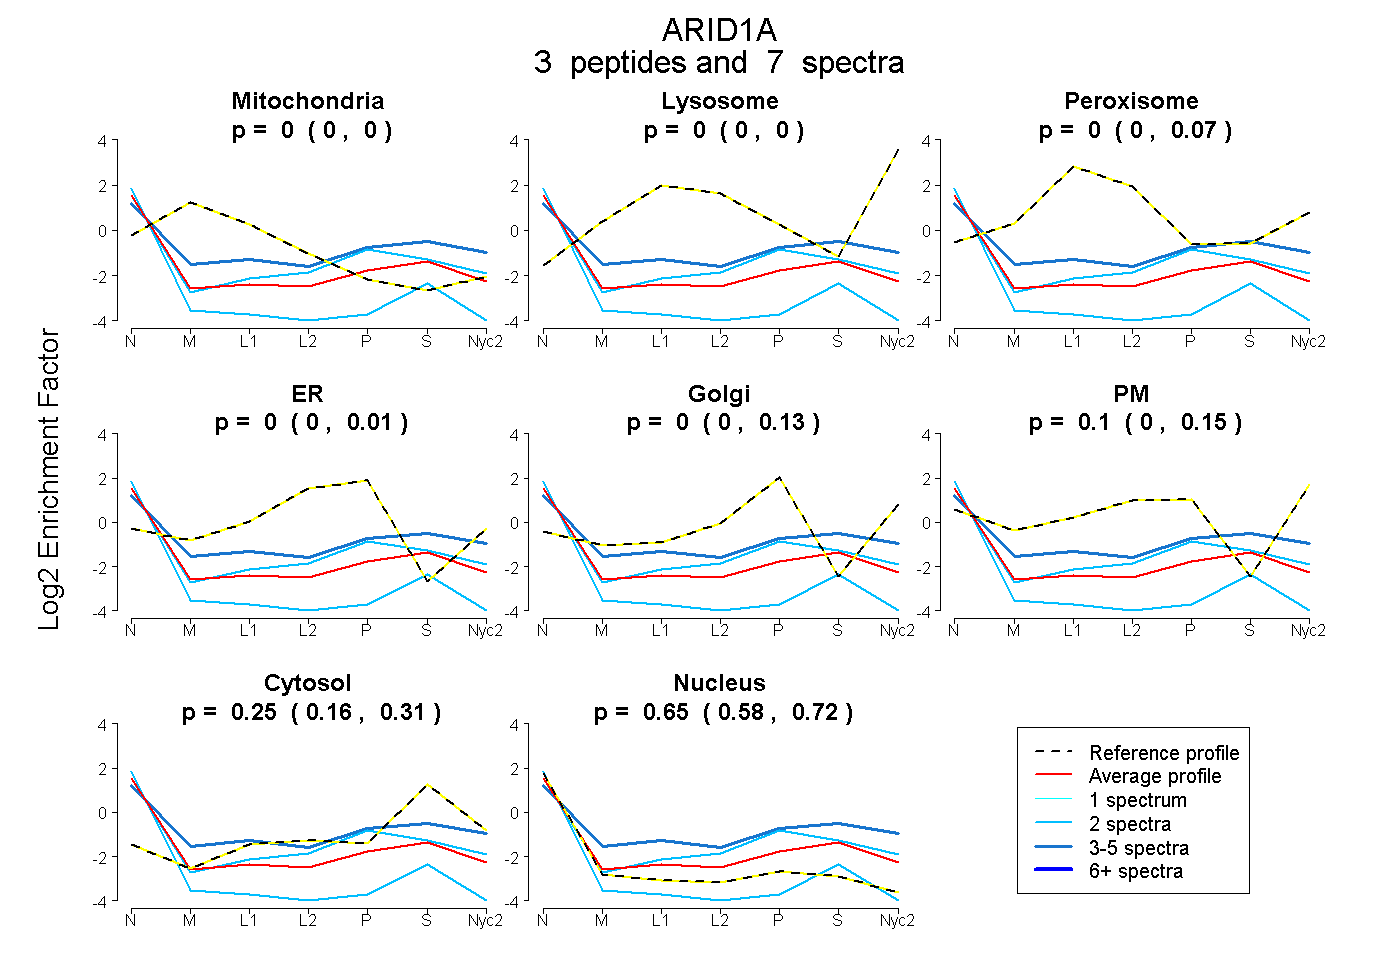
0.000 | 0.000
0.000 | 0.000
0.000 | 0.072
0.000 | 0.008
0.000 | 0.126
0.000 | 0.153
0.160 | 0.309
0.579 | 0.720
| Plot | Mito | Lyso | Perox | ER | Golgi | PM | Cytosol | Nucleus | |||||
| Expt A |
3 peptides |
7 spectra |
|
0.000 0.000 | 0.000 |
0.000 0.000 | 0.000 |
0.000 0.000 | 0.072 |
0.000 0.000 | 0.008 |
0.000 0.000 | 0.126 |
0.097 0.000 | 0.153 |
0.249 0.160 | 0.309 |
0.654 0.579 | 0.720 |
| 3 spectra, FPFGISPAQSHR | 0.000 | 0.000 | 0.020 | 0.000 | 0.000 | 0.299 | 0.351 | 0.330 | ||
| 2 spectra, IELLPSRPCVPSPVPPR | 0.000 | 0.000 | 0.000 | 0.000 | 0.000 | 0.000 | 0.000 | 1.000 | ||
| 2 spectra, VDENHSEFTLYESR | 0.000 | 0.000 | 0.000 | 0.000 | 0.122 | 0.109 | 0.228 | 0.541 |
| Plot | Lyso | Other | |||||||||||
| Expt C |
1 peptide |
2 spectra |
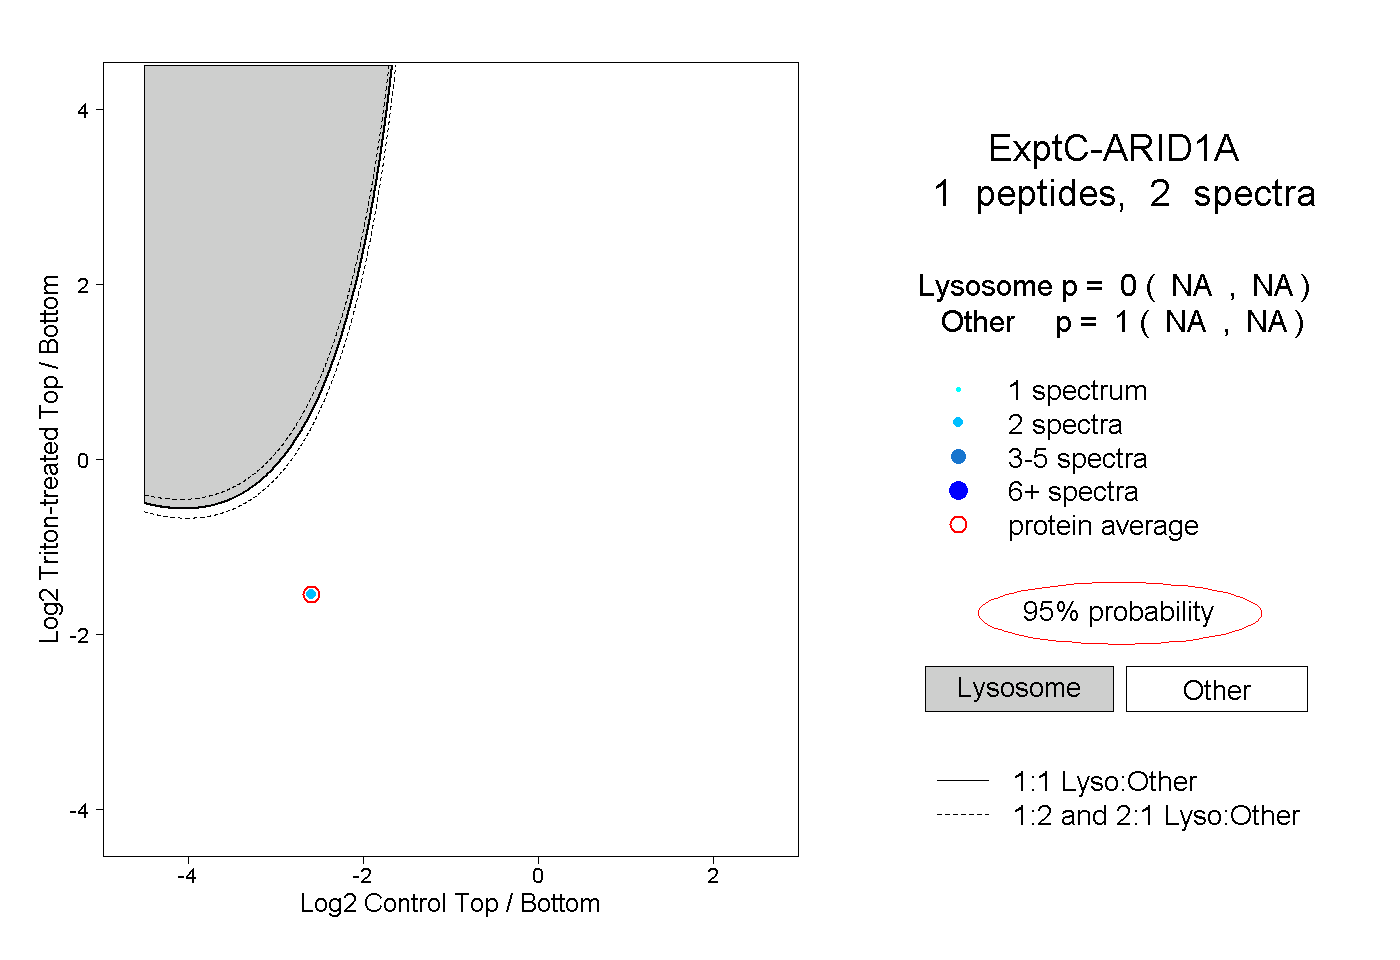 |
0.000 NA | NA |
1.000 NA | NA |