 6
6peptides
spectra
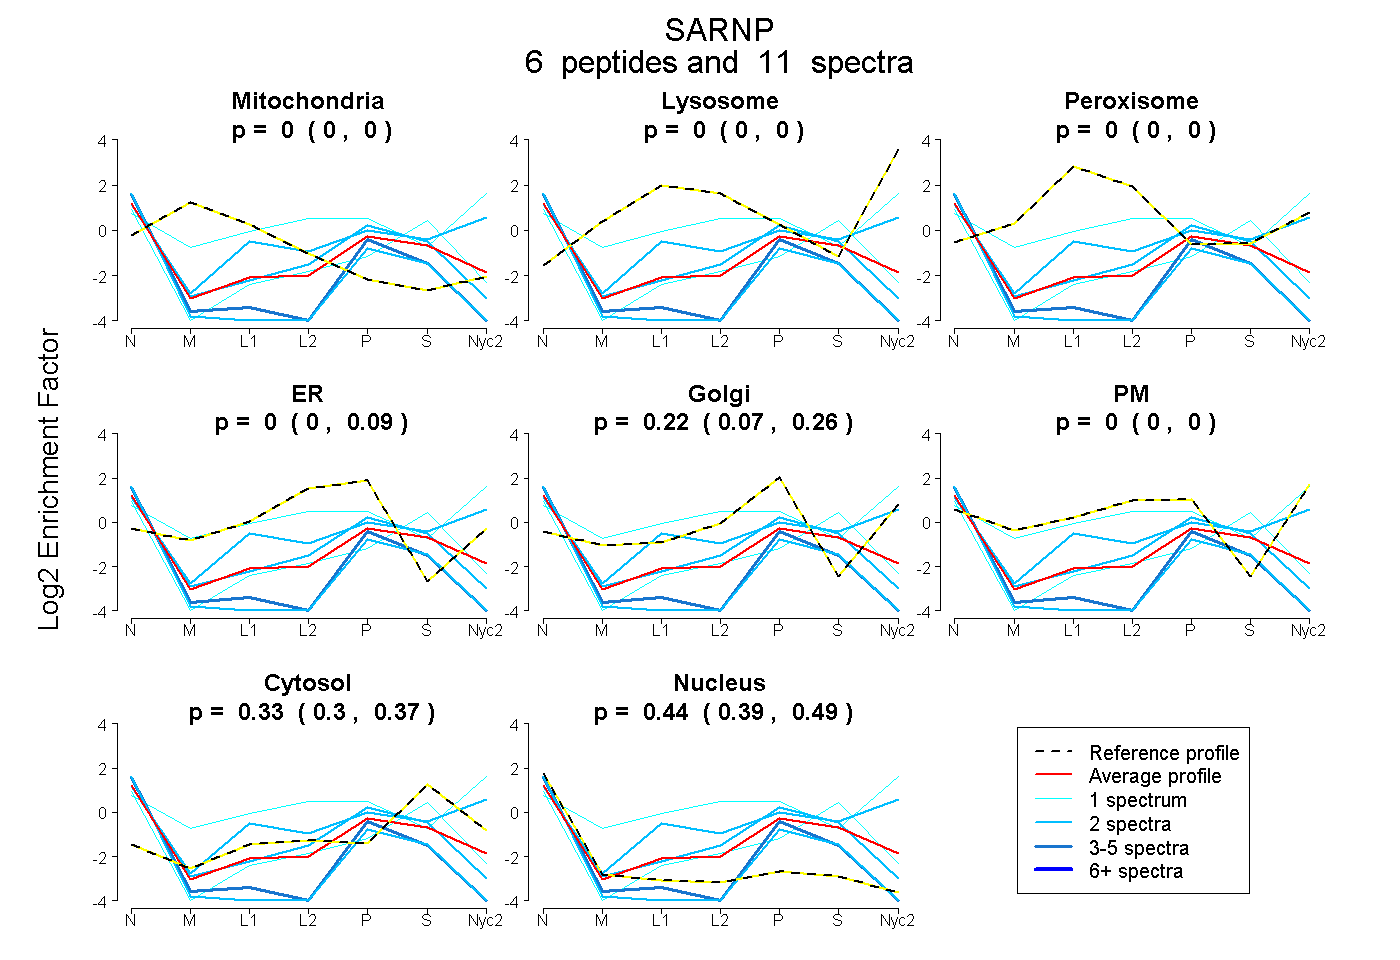
0.000 | 0.000
0.000 | 0.000
0.000 | 0.000
0.000 | 0.088
0.075 | 0.261
0.000 | 0.000
0.297 | 0.365
0.389 | 0.491
| Plot | Mito | Lyso | Perox | ER | Golgi | PM | Cytosol | Nucleus | |||||
| Expt A |
6 peptides |
11 spectra |
|
0.000 0.000 | 0.000 |
0.000 0.000 | 0.000 |
0.000 0.000 | 0.000 |
0.000 0.000 | 0.088 |
0.221 0.075 | 0.261 |
0.000 0.000 | 0.000 |
0.335 0.297 | 0.365 |
0.445 0.389 | 0.491 |
| 2 spectra, GLSSDTKPMVNLDK | 0.000 | 0.000 | 0.000 | 0.210 | 0.000 | 0.000 | 0.326 | 0.464 | ||
| 1 spectrum, ATETVELHK | 0.000 | 0.000 | 0.000 | 0.000 | 0.000 | 0.000 | 0.587 | 0.413 | ||
| 2 spectra, QECLAR | 0.000 | 0.000 | 0.000 | 0.000 | 0.000 | 0.457 | 0.418 | 0.125 | ||
| 2 spectra, ITSGIPQTER | 0.000 | 0.000 | 0.000 | 0.000 | 0.000 | 0.000 | 0.101 | 0.899 | ||
| 3 spectra, FGLNVSSISR | 0.000 | 0.000 | 0.000 | 0.000 | 0.005 | 0.000 | 0.134 | 0.862 | ||
| 1 spectrum, FGIVTSSAGTGTTEDTEAK | 0.000 | 0.064 | 0.013 | 0.000 | 0.000 | 0.695 | 0.228 | 0.000 |
| Plot | Mito | Lyso or Perox | ER | Golgi | PM | Cytosol | Nucleus | ||||||
| Expt B |
1 peptide |
1 spectrum |
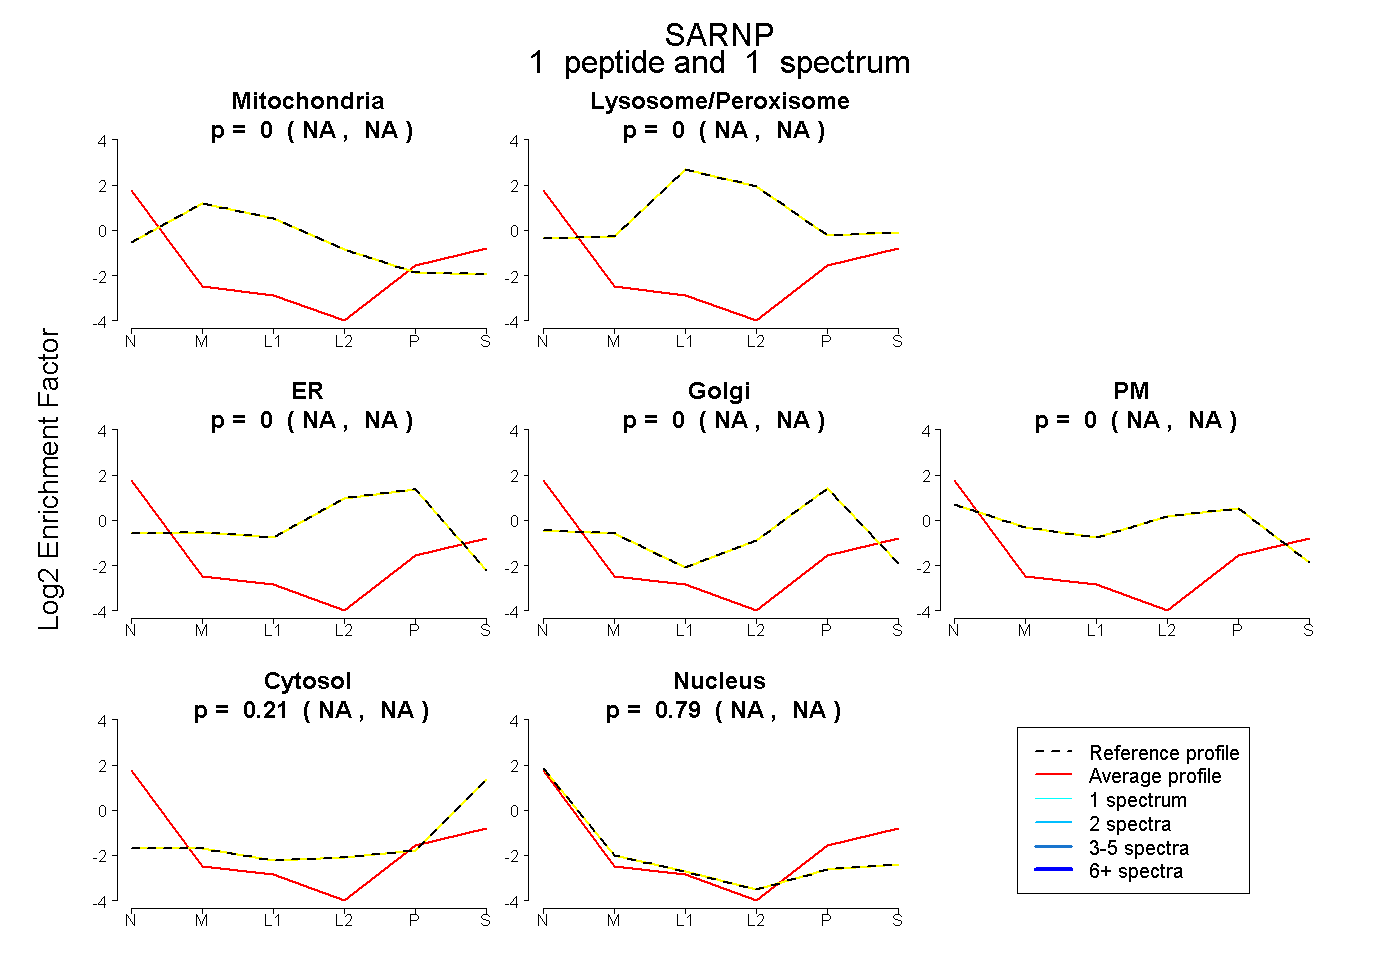 |
0.000 NA | NA |
0.000 NA | NA |
0.000 NA | NA |
0.000 NA | NA |
0.000 NA | NA |
0.209 NA | NA |
0.791 NA | NA |