 16
16peptides
spectra
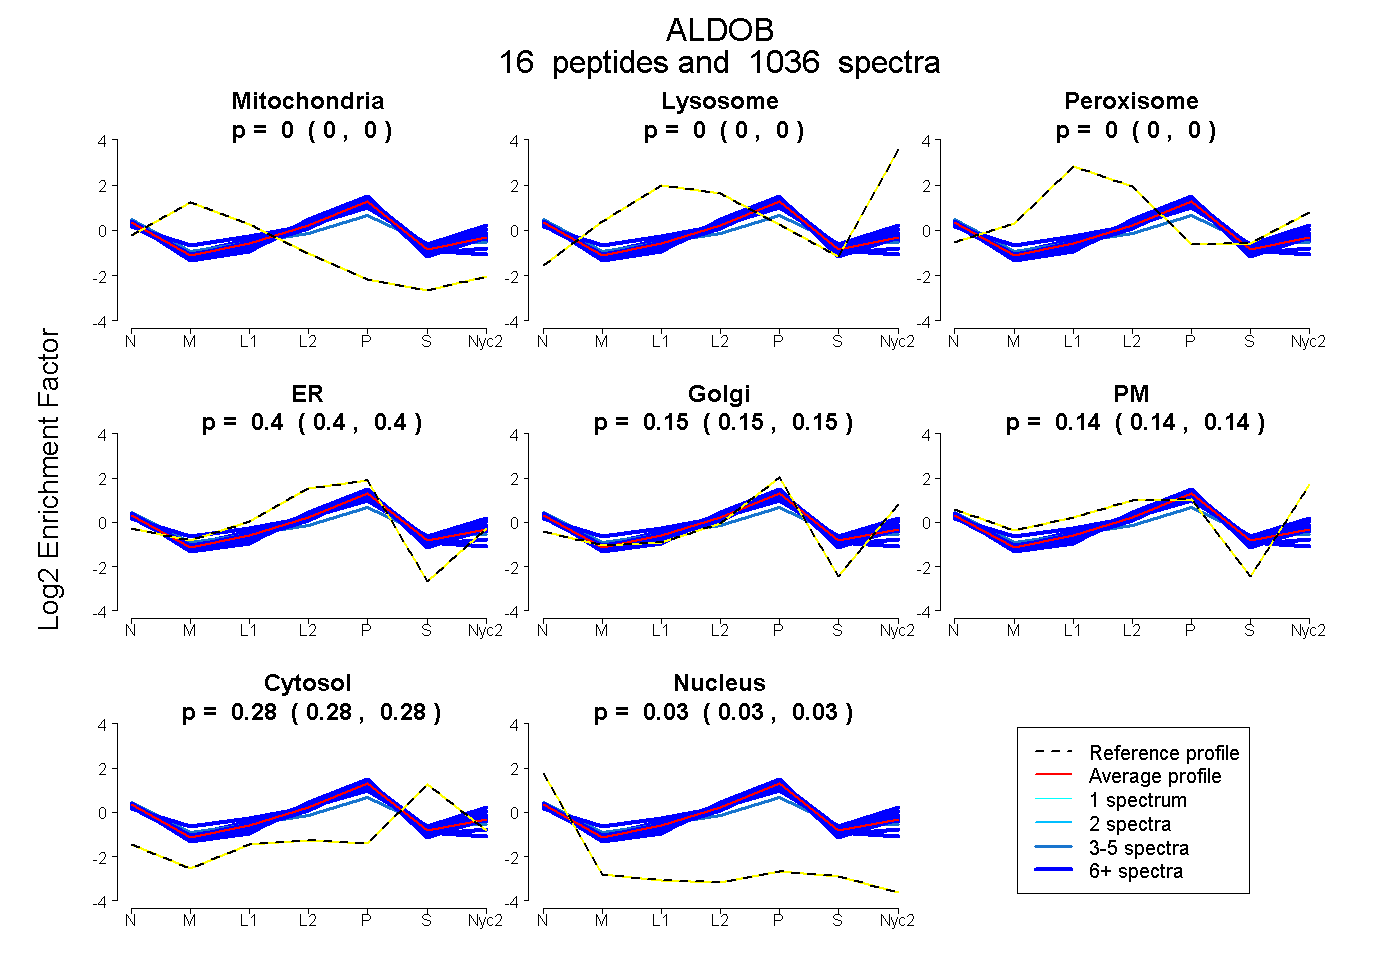
0.000 | 0.000
0.000 | 0.000
0.000 | 0.000
0.396 | 0.400
0.147 | 0.149
0.142 | 0.145
0.284 | 0.285
0.025 | 0.026
14peptides
spectra
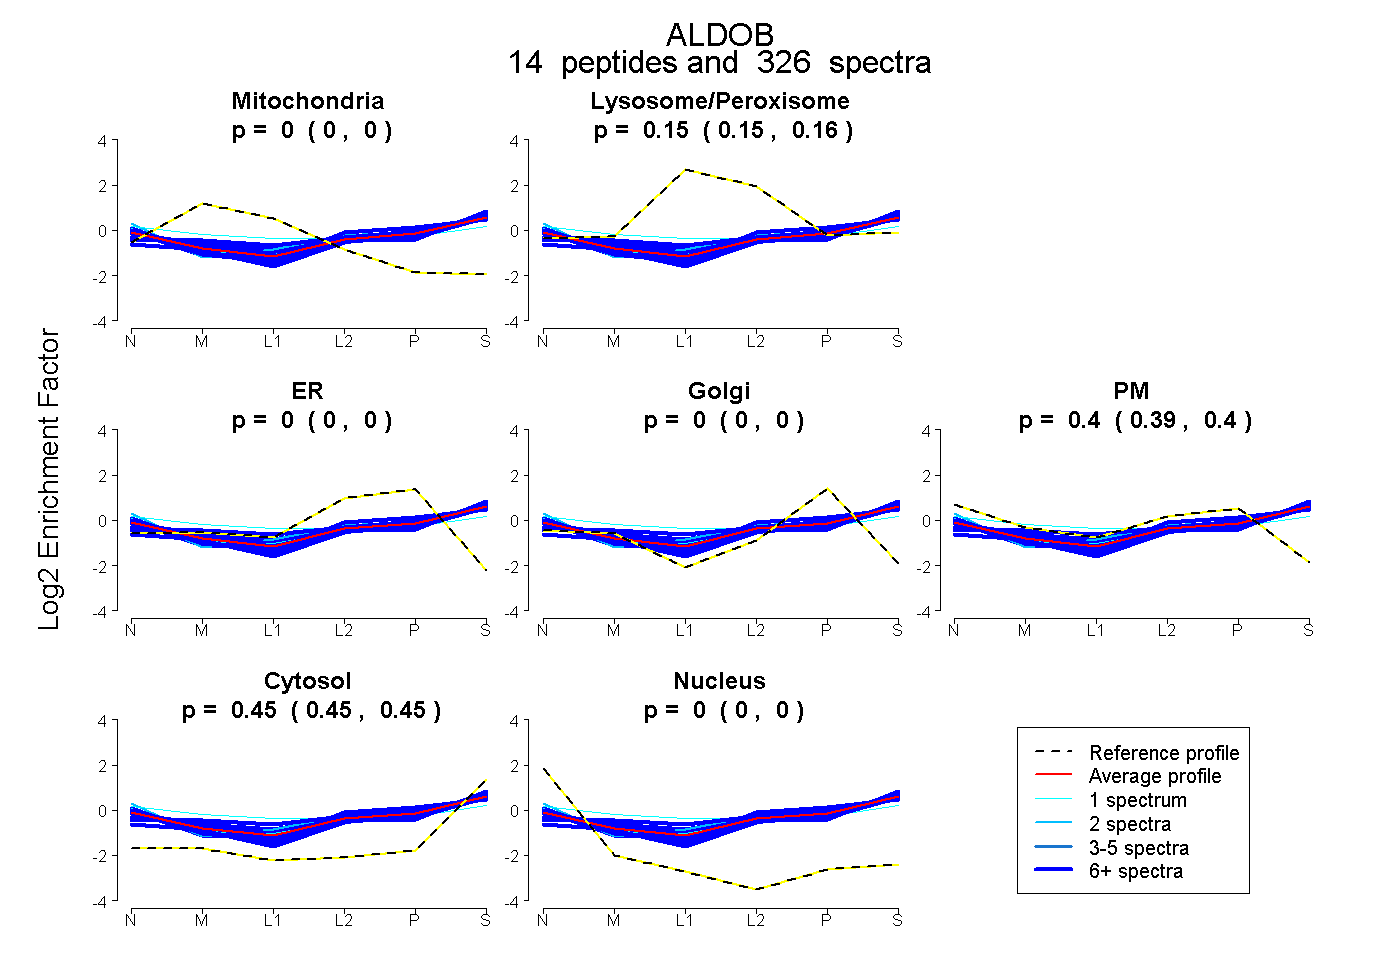
0.000 | 0.000
0.152 | 0.155
0.000 | 0.000
0.000 | 0.000
0.394 | 0.397
0.450 | 0.452
0.000 | 0.000
17peptides
spectra
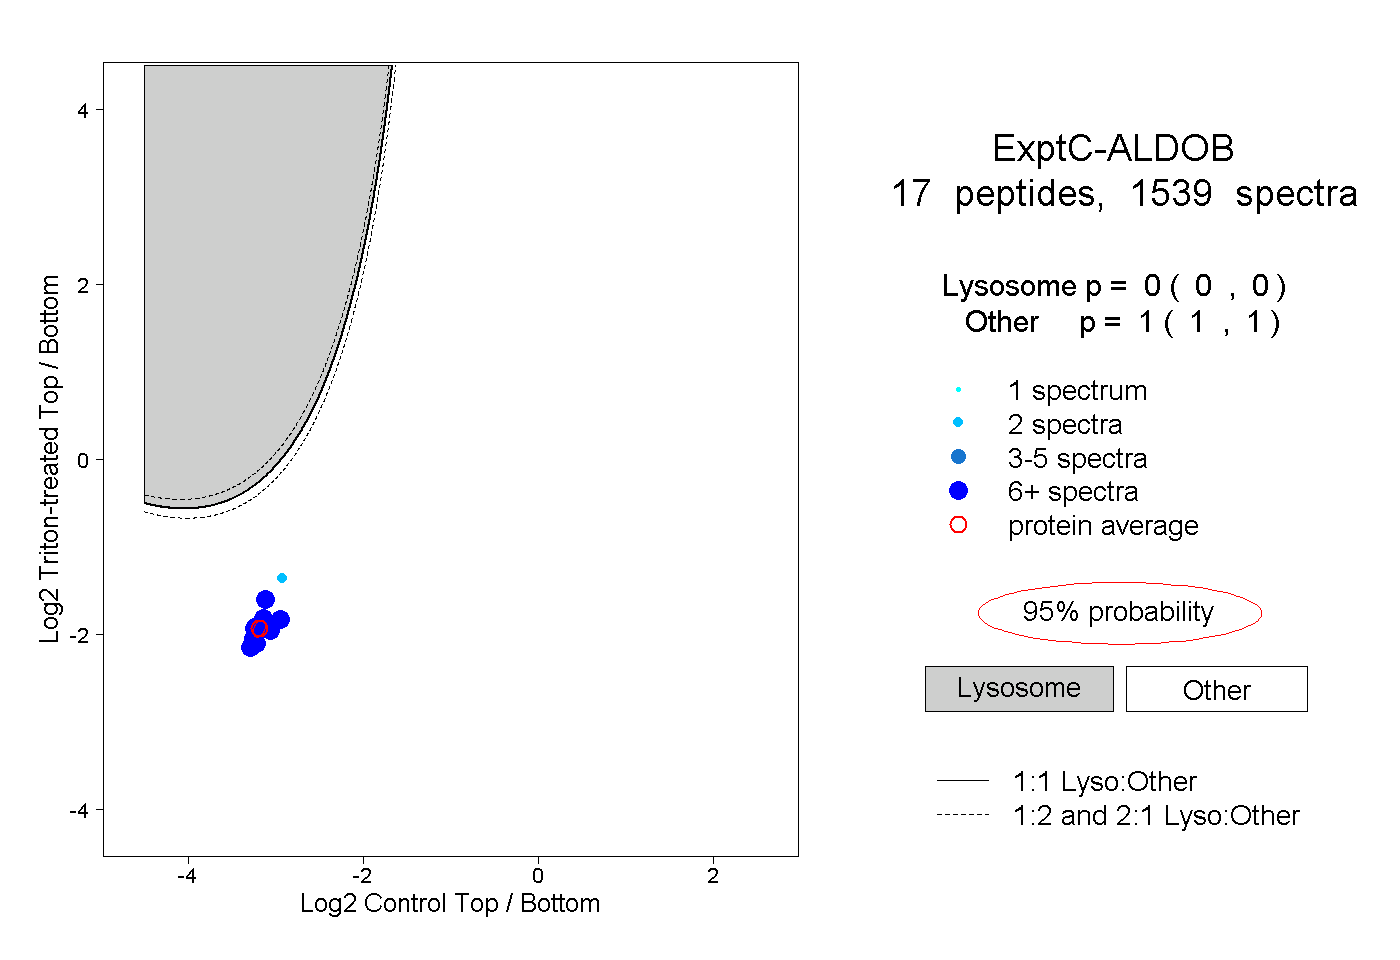
0.000 | 0.000
1.000 | 1.000
16peptides
spectra
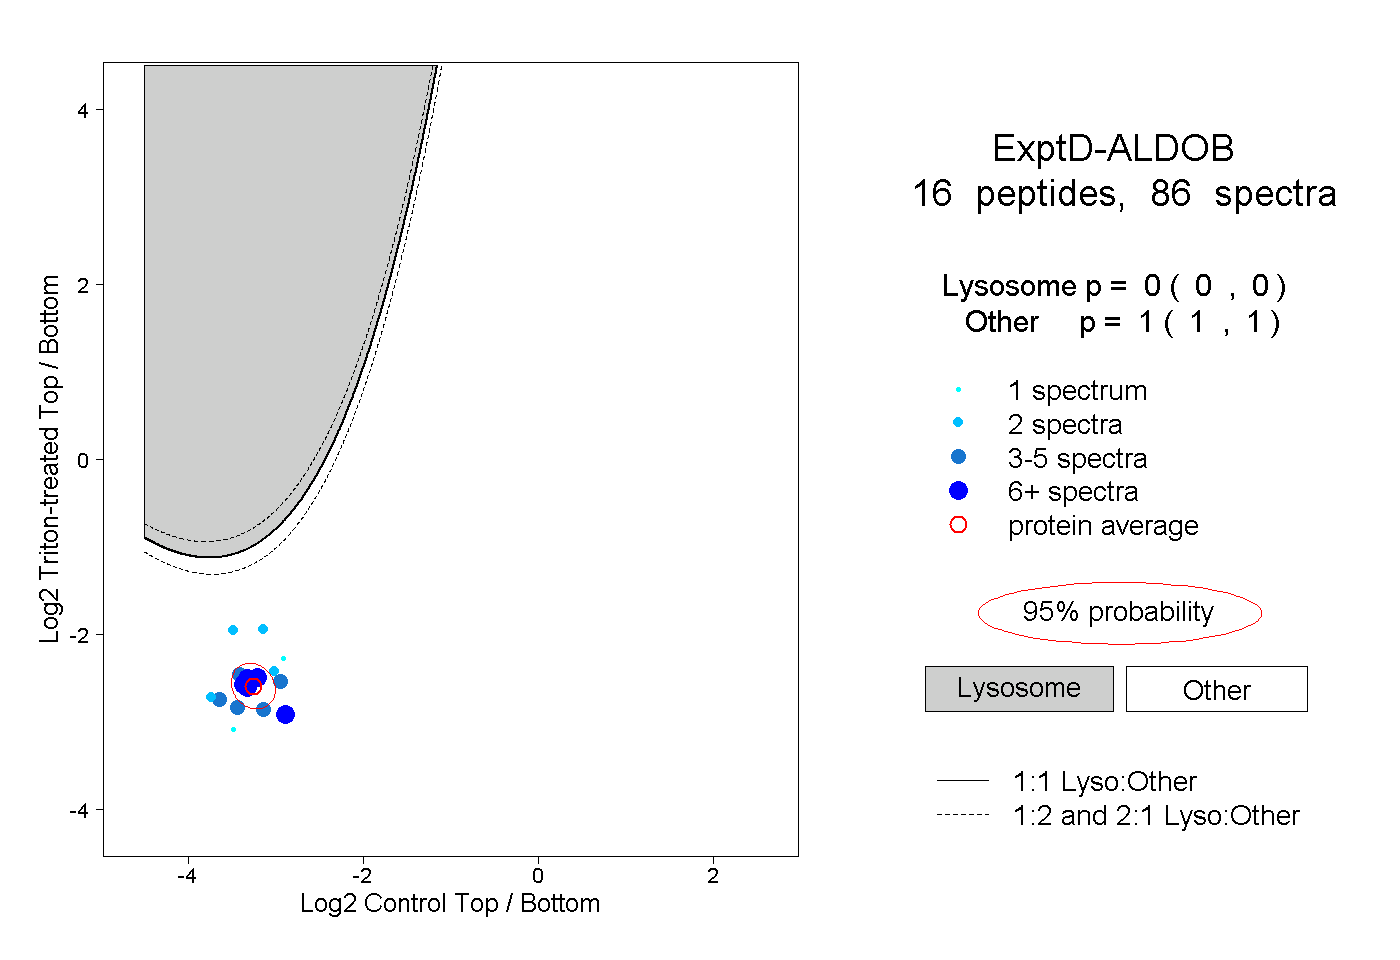
0.000 | 0.000
1.000 | 1.000