 3
3peptides
spectra
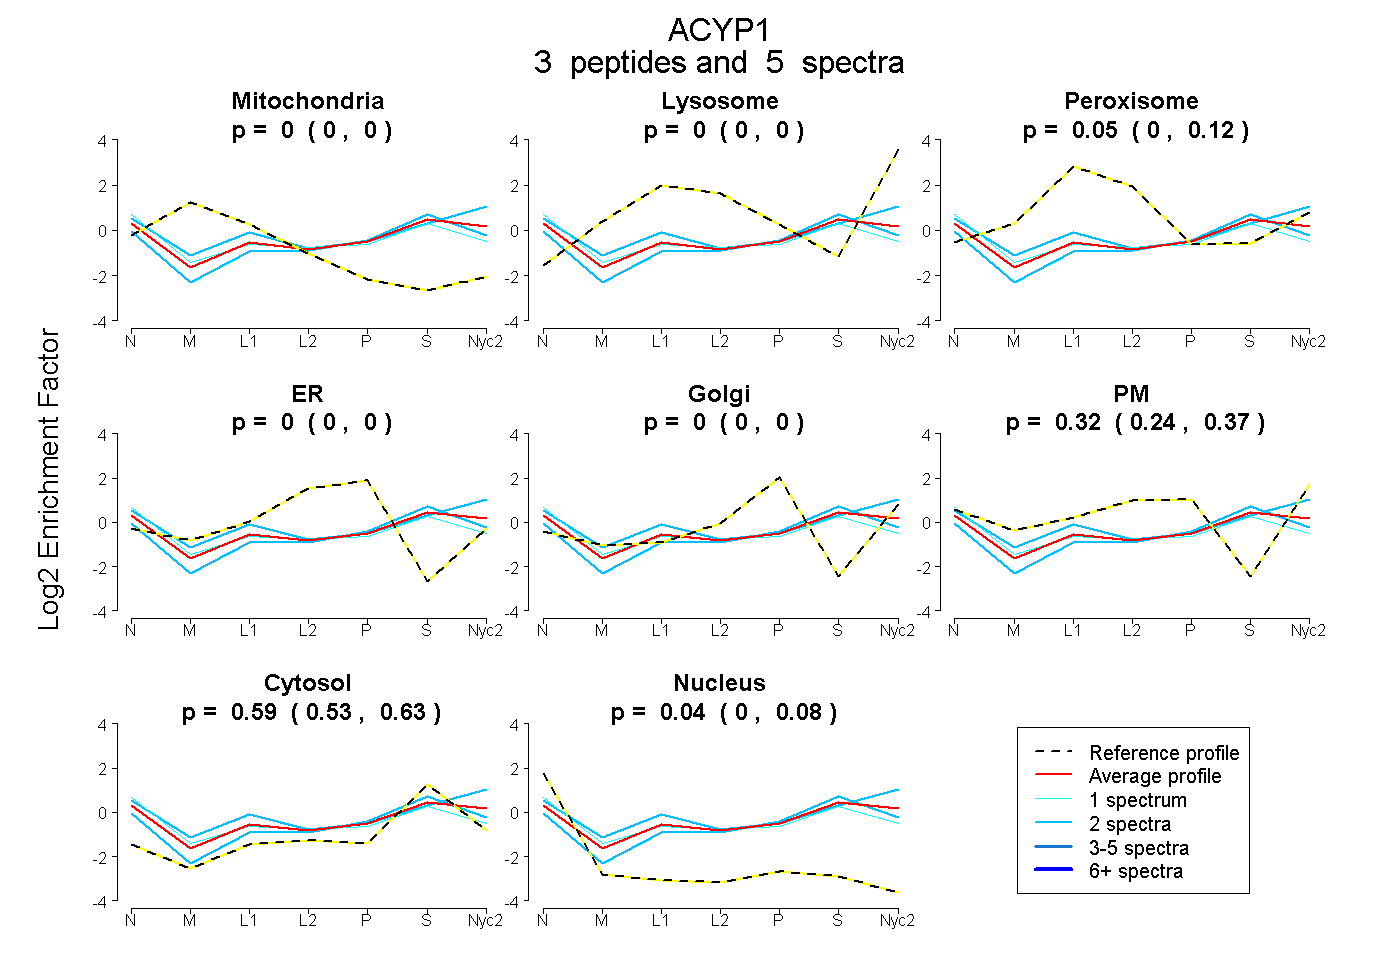
0.000 | 0.000
0.000 | 0.000
0.000 | 0.118
0.000 | 0.000
0.000 | 0.000
0.238 | 0.373
0.533 | 0.633
0.000 | 0.080
| Plot | Mito | Lyso | Perox | ER | Golgi | PM | Cytosol | Nucleus | |||||
| Expt A |
3 peptides |
5 spectra |
|
0.000 0.000 | 0.000 |
0.000 0.000 | 0.000 |
0.055 0.000 | 0.118 |
0.000 0.000 | 0.000 |
0.000 0.000 | 0.000 |
0.317 0.238 | 0.373 |
0.592 0.533 | 0.633 |
0.037 0.000 | 0.080 |
| 2 spectra, LGLVGWVQNTNR | 0.000 | 0.000 | 0.000 | 0.000 | 0.000 | 0.252 | 0.725 | 0.023 | ||
| 1 spectrum, GTVQGQLQGPVSK | 0.000 | 0.000 | 0.151 | 0.000 | 0.000 | 0.220 | 0.471 | 0.158 | ||
| 2 spectra, FMQEWLEK | 0.000 | 0.045 | 0.071 | 0.000 | 0.000 | 0.384 | 0.497 | 0.002 |
| Plot | Lyso | Other | |||||||||||
| Expt C |
4 peptides |
8 spectra |
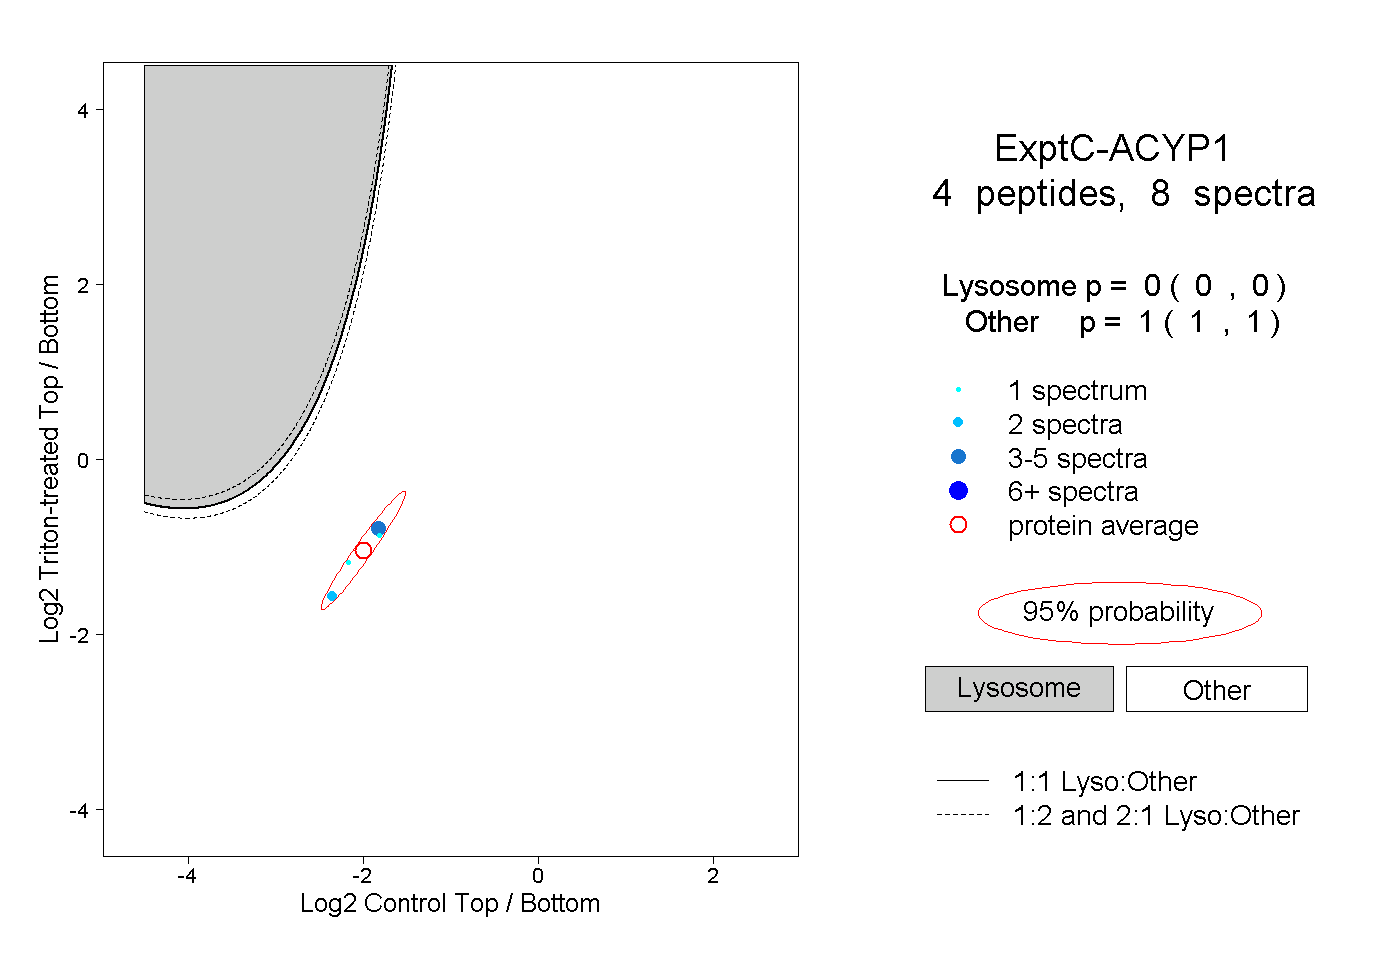 |
0.000 0.000 | 0.000 |
1.000 1.000 | 1.000 |