 2
2peptides
spectra
0.000 | 0.108
0.000 | 0.000
0.000 | 0.101
0.000 | 0.216
0.000 | 0.213
0.000 | 0.044
0.203 | 0.296
0.385 | 0.477
| Plot | Mito | Lyso | Perox | ER | Golgi | PM | Cytosol | Nucleus | |||||
| Expt A |
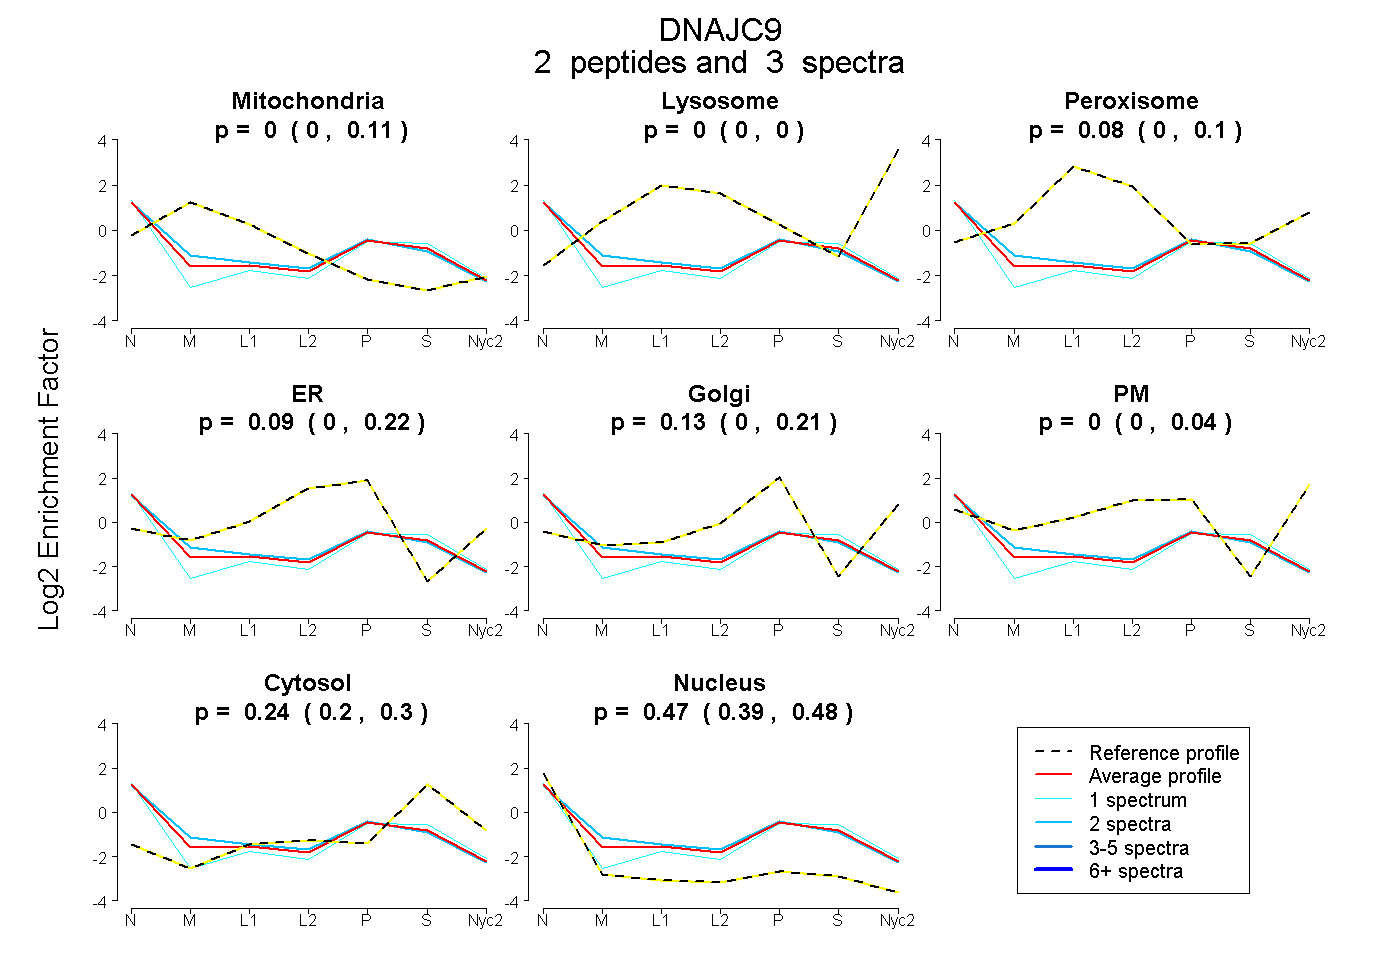
2 peptides |
3 spectra |
|
0.000 0.000 | 0.108 |
0.000 0.000 | 0.000 |
0.076 0.000 | 0.101 |
0.092 0.000 | 0.216 |
0.128 0.000 | 0.213 |
0.000 0.000 | 0.044 |
0.239 0.203 | 0.296 |
0.465 0.385 | 0.477 |
| 2 spectra, ISLEDIQAFEK | 0.101 | 0.000 | 0.045 | 0.138 | 0.099 | 0.000 | 0.210 | 0.407 | ||
| 1 spectrum, ALIQSR | 0.000 | 0.000 | 0.000 | 0.012 | 0.184 | 0.000 | 0.346 | 0.457 |
| Plot | Lyso | Other | |||||||||||
| Expt D |
1 peptide |
2 spectra |
 |
0.000 NA | NA |
1.000 NA | NA |