 14
14peptides
spectra
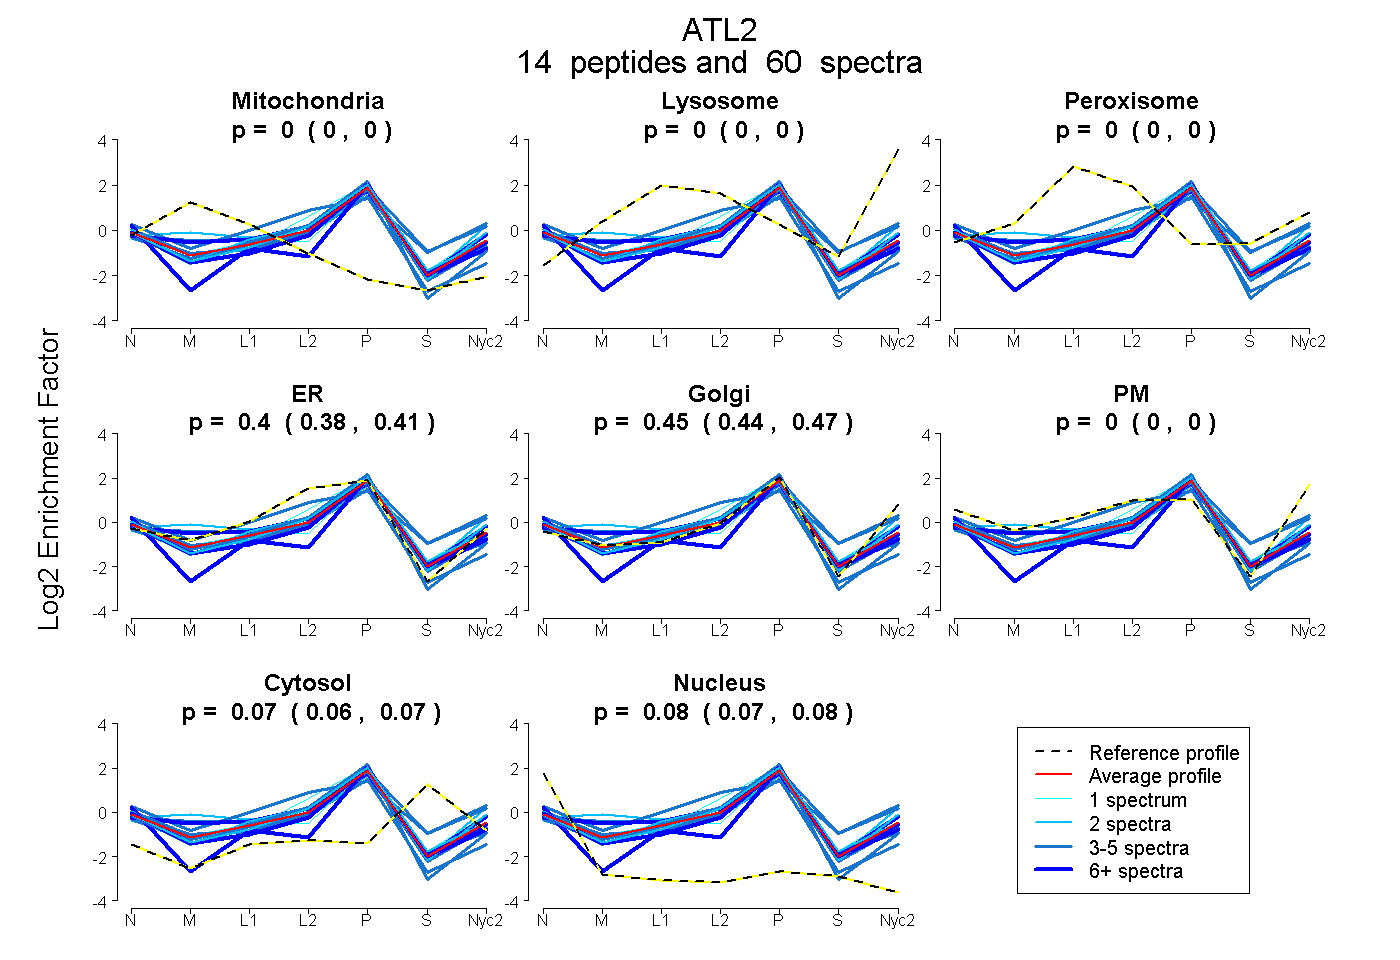
0.000 | 0.000
0.000 | 0.000
0.000 | 0.000
0.384 | 0.411
0.437 | 0.467
0.000 | 0.000
0.061 | 0.075
0.075 | 0.084
9peptides
spectra
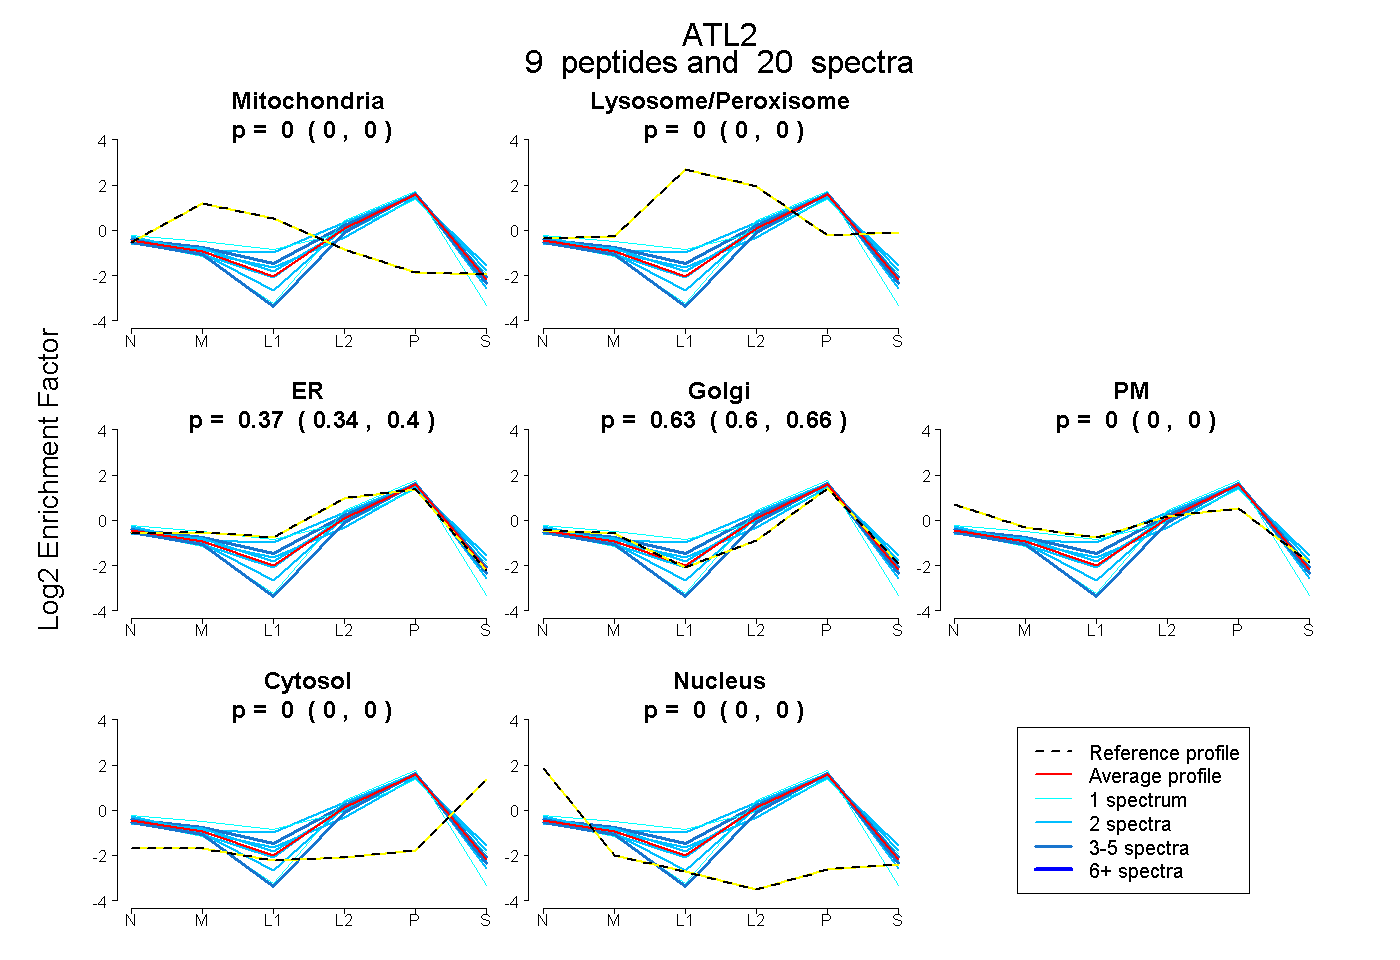
0.000 | 0.000
0.000 | 0.000
0.335 | 0.398
0.596 | 0.658
0.000 | 0.000
0.000 | 0.000
0.000 | 0.000
12peptides
spectra
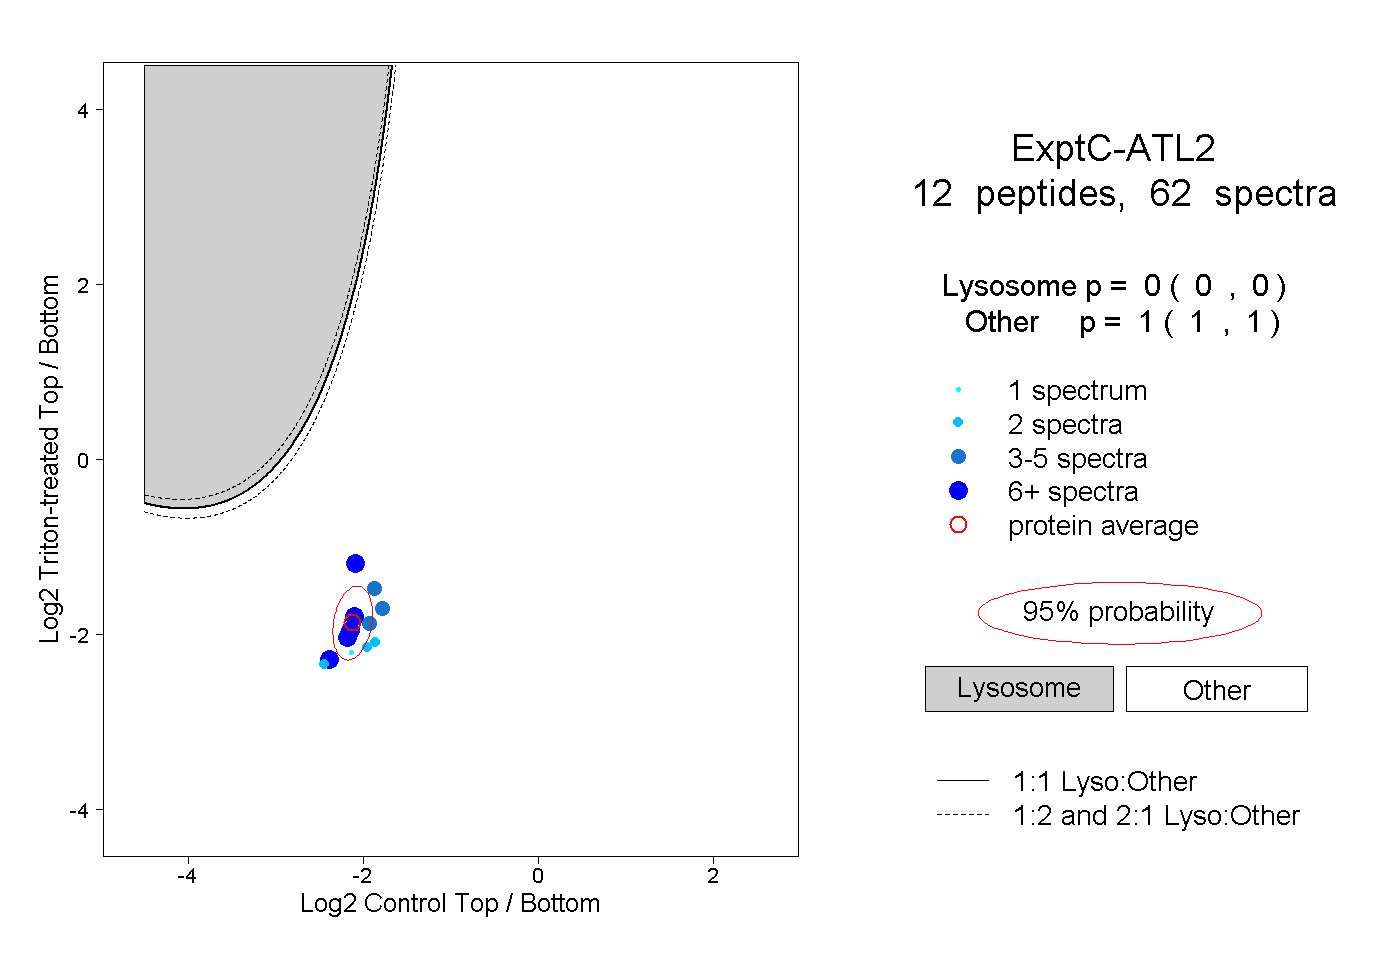
0.000 | 0.000
1.000 | 1.000
5peptides
spectra
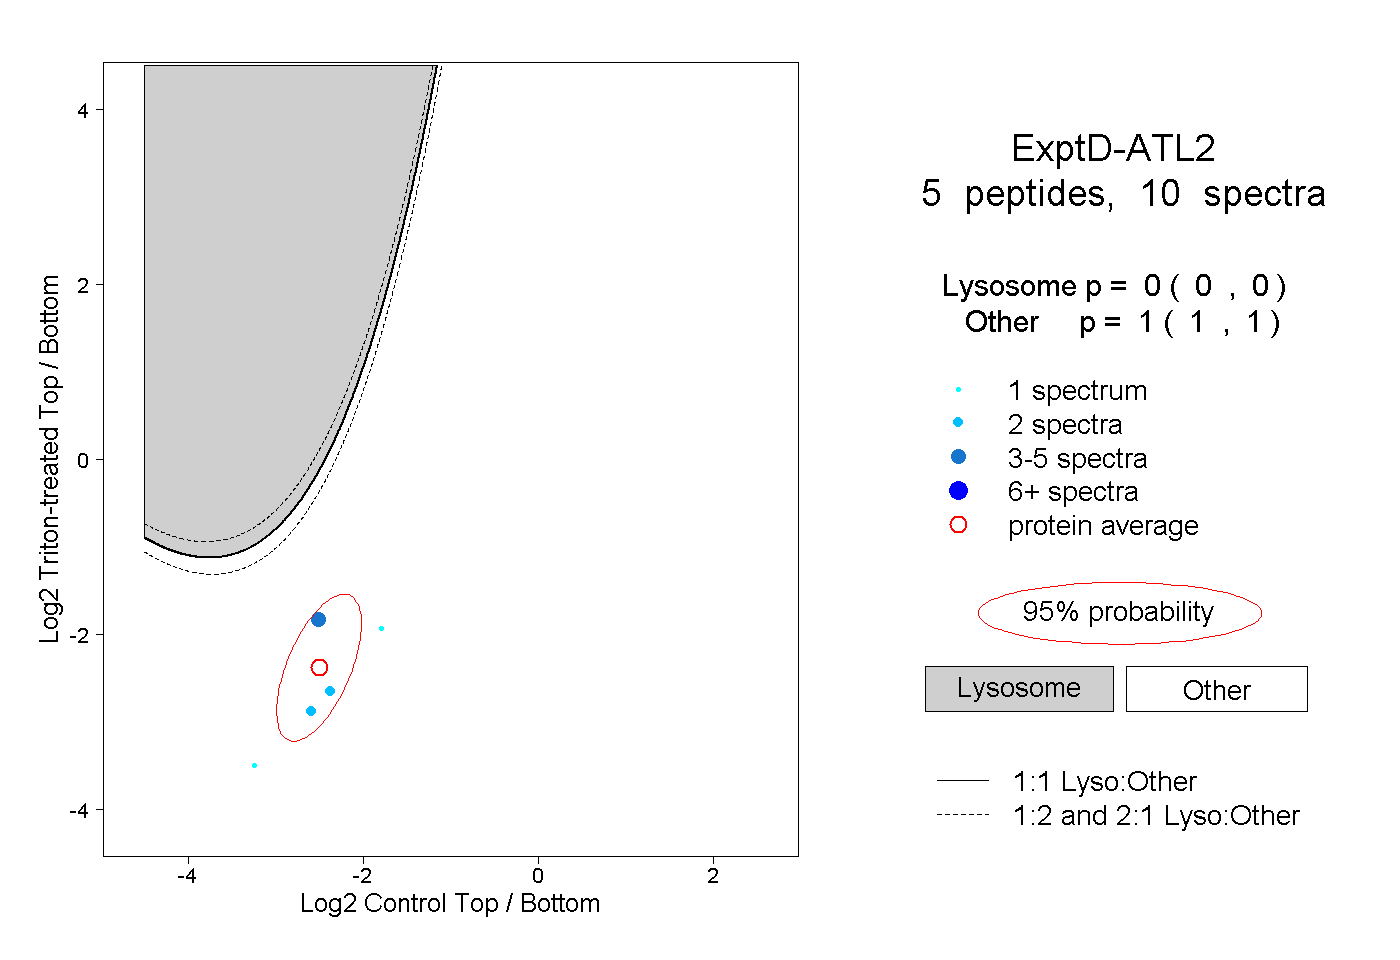
0.000 | 0.000
1.000 | 1.000