 14
14peptides
spectra
0.000 | 0.000
0.000 | 0.000
0.000 | 0.000
0.384 | 0.411
0.437 | 0.467
0.000 | 0.000
0.061 | 0.075
0.075 | 0.084
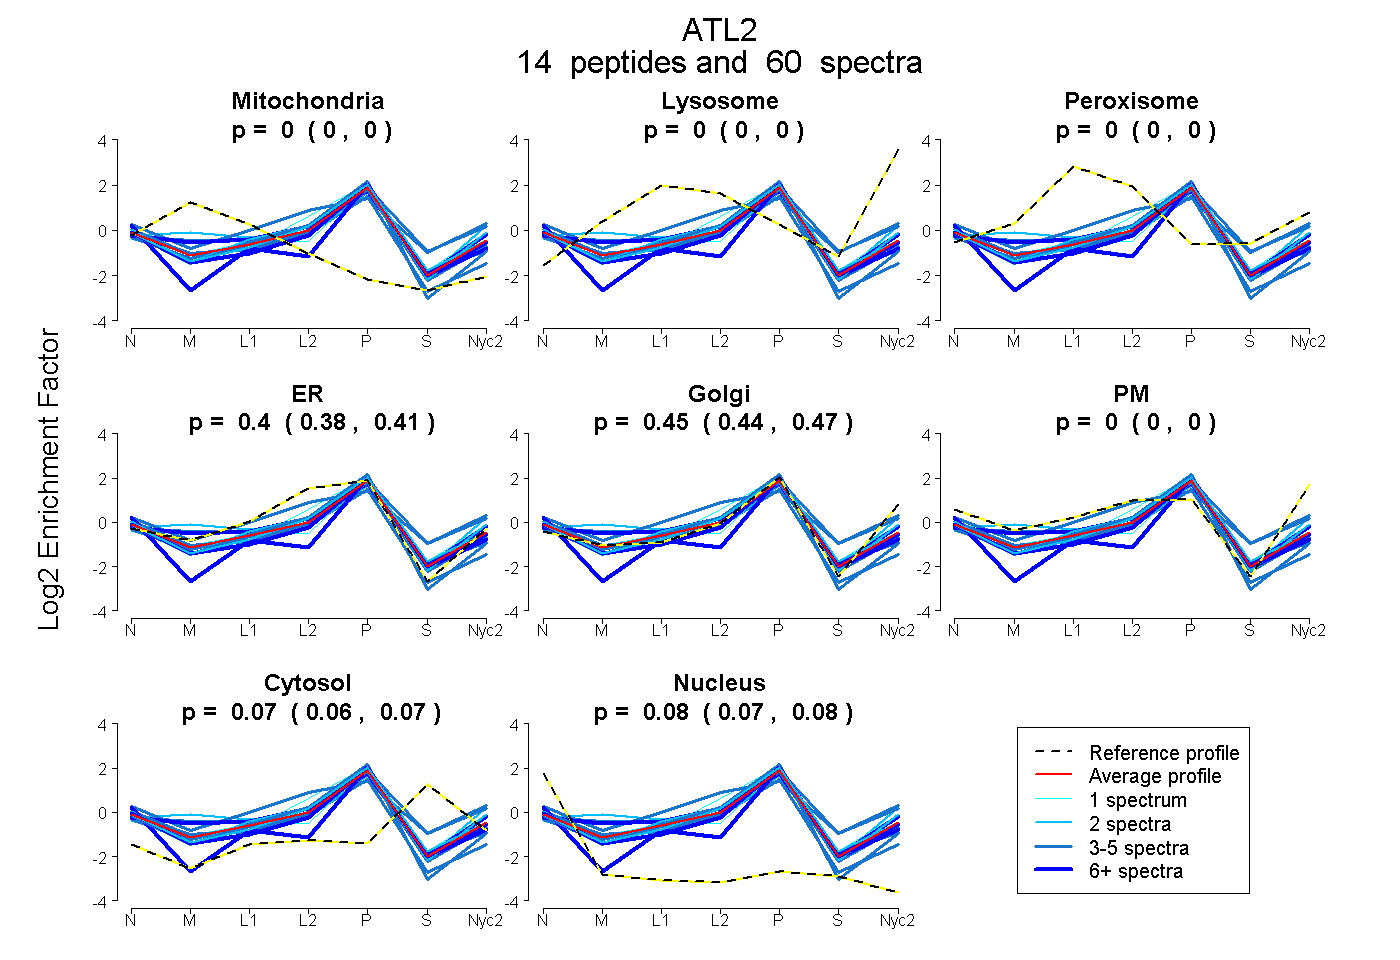
| Plot | Mito | Lyso | Perox | ER | Golgi | PM | Cytosol | Nucleus | |||||
| Expt A |
14 peptides |
60 spectra |
|
0.000 0.000 | 0.000 |
0.000 0.000 | 0.000 |
0.000 0.000 | 0.000 |
0.398 0.384 | 0.411 |
0.454 0.437 | 0.467 |
0.000 0.000 | 0.000 |
0.069 0.061 | 0.075 |
0.080 0.075 | 0.084 |
| 2 spectra, EISGSK | 0.147 | 0.000 | 0.071 | 0.012 | 0.769 | 0.000 | 0.000 | 0.000 | ||
| 5 spectra, SMEQVCGGDKPYIAPSDLER | 0.000 | 0.000 | 0.000 | 0.612 | 0.260 | 0.000 | 0.000 | 0.128 | ||
| 1 spectrum, ETTGIQVWNEVFVIDRPNGTK | 0.000 | 0.000 | 0.000 | 0.452 | 0.439 | 0.000 | 0.109 | 0.000 | ||
| 4 spectra, QNQHEELQNVR | 0.000 | 0.000 | 0.000 | 0.384 | 0.464 | 0.000 | 0.013 | 0.140 | ||
| 2 spectra, YSGEFR | 0.000 | 0.000 | 0.000 | 0.400 | 0.438 | 0.000 | 0.111 | 0.050 | ||
| 8 spectra, NIFYAAR | 0.099 | 0.000 | 0.000 | 0.352 | 0.491 | 0.000 | 0.057 | 0.000 | ||
| 5 spectra, IYQGEELPHPK | 0.000 | 0.000 | 0.000 | 0.465 | 0.354 | 0.000 | 0.081 | 0.100 | ||
| 6 spectra, VATNPSFDGR | 0.000 | 0.000 | 0.000 | 0.242 | 0.593 | 0.000 | 0.056 | 0.109 | ||
| 2 spectra, QSVTNSIK | 0.000 | 0.000 | 0.000 | 0.400 | 0.511 | 0.000 | 0.034 | 0.054 | ||
| 12 spectra, QQPQQGLR | 0.000 | 0.000 | 0.000 | 0.015 | 0.732 | 0.000 | 0.053 | 0.200 | ||
| 5 spectra, DLVEYFK | 0.157 | 0.000 | 0.000 | 0.561 | 0.164 | 0.000 | 0.000 | 0.117 | ||
| 3 spectra, ILLQEHIR | 0.000 | 0.000 | 0.075 | 0.399 | 0.019 | 0.316 | 0.191 | 0.000 | ||
| 4 spectra, MGGDEFCR | 0.000 | 0.000 | 0.020 | 0.262 | 0.508 | 0.000 | 0.210 | 0.000 | ||
| 1 spectrum, DWSYPYEHSYGLEGGK | 0.000 | 0.000 | 0.000 | 0.309 | 0.506 | 0.000 | 0.084 | 0.101 |
| Plot | Mito | Lyso or Perox | ER | Golgi | PM | Cytosol | Nucleus | ||||||
| Expt B |
9 peptides |
20 spectra |
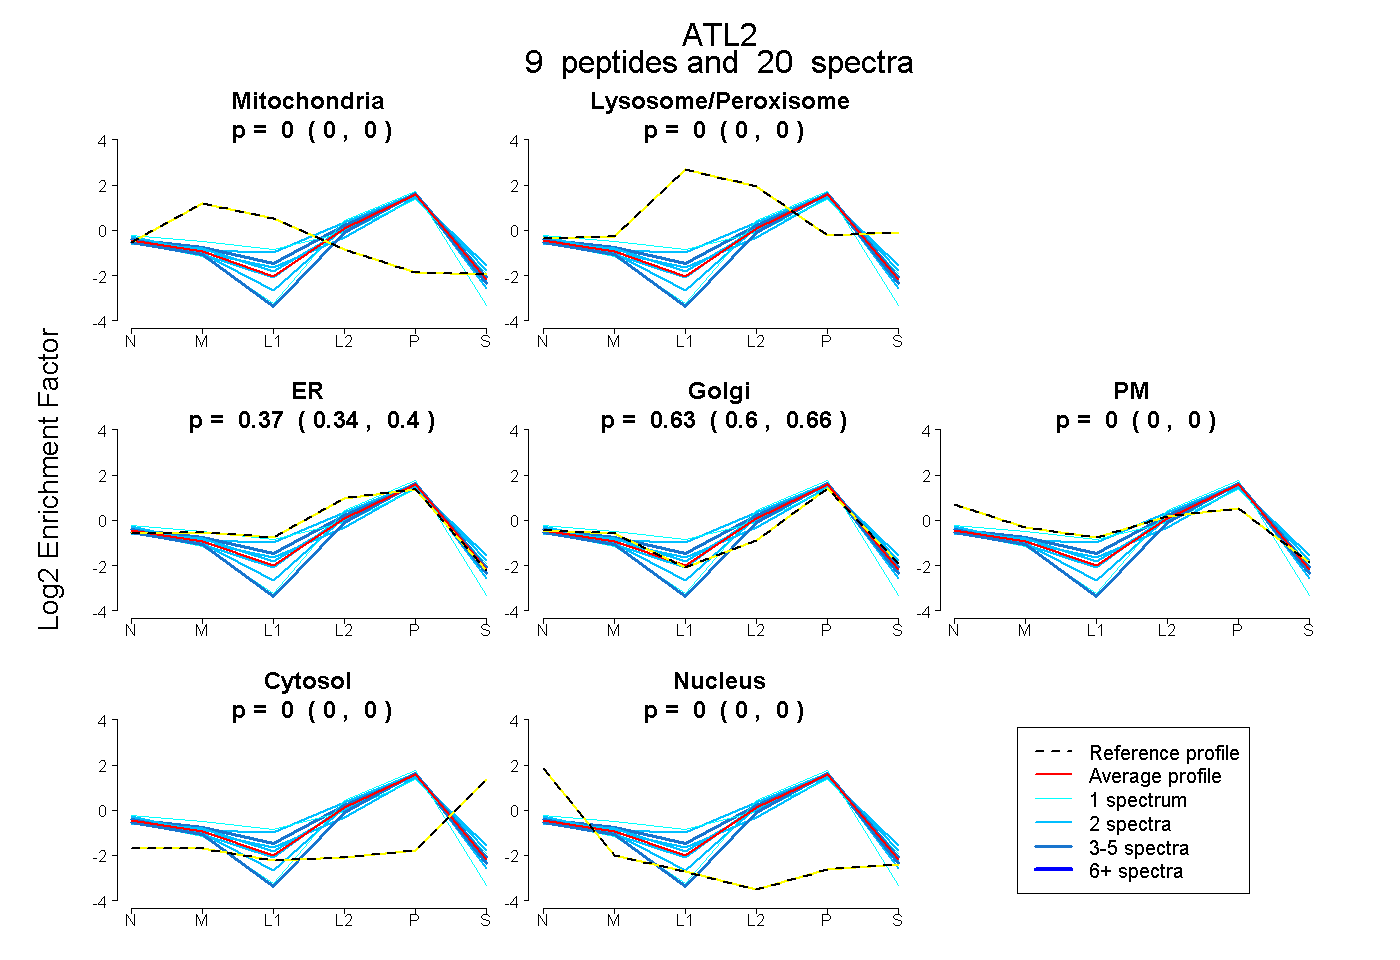 |
0.000 0.000 | 0.000 |
0.000 0.000 | 0.000 |
0.371 0.335 | 0.398 |
0.629 0.596 | 0.658 |
0.000 0.000 | 0.000 |
0.000 0.000 | 0.000 |
0.000 0.000 | 0.000 |
|||
| Plot | Lyso | Other | |||||||||||
| Expt C |
12 peptides |
62 spectra |
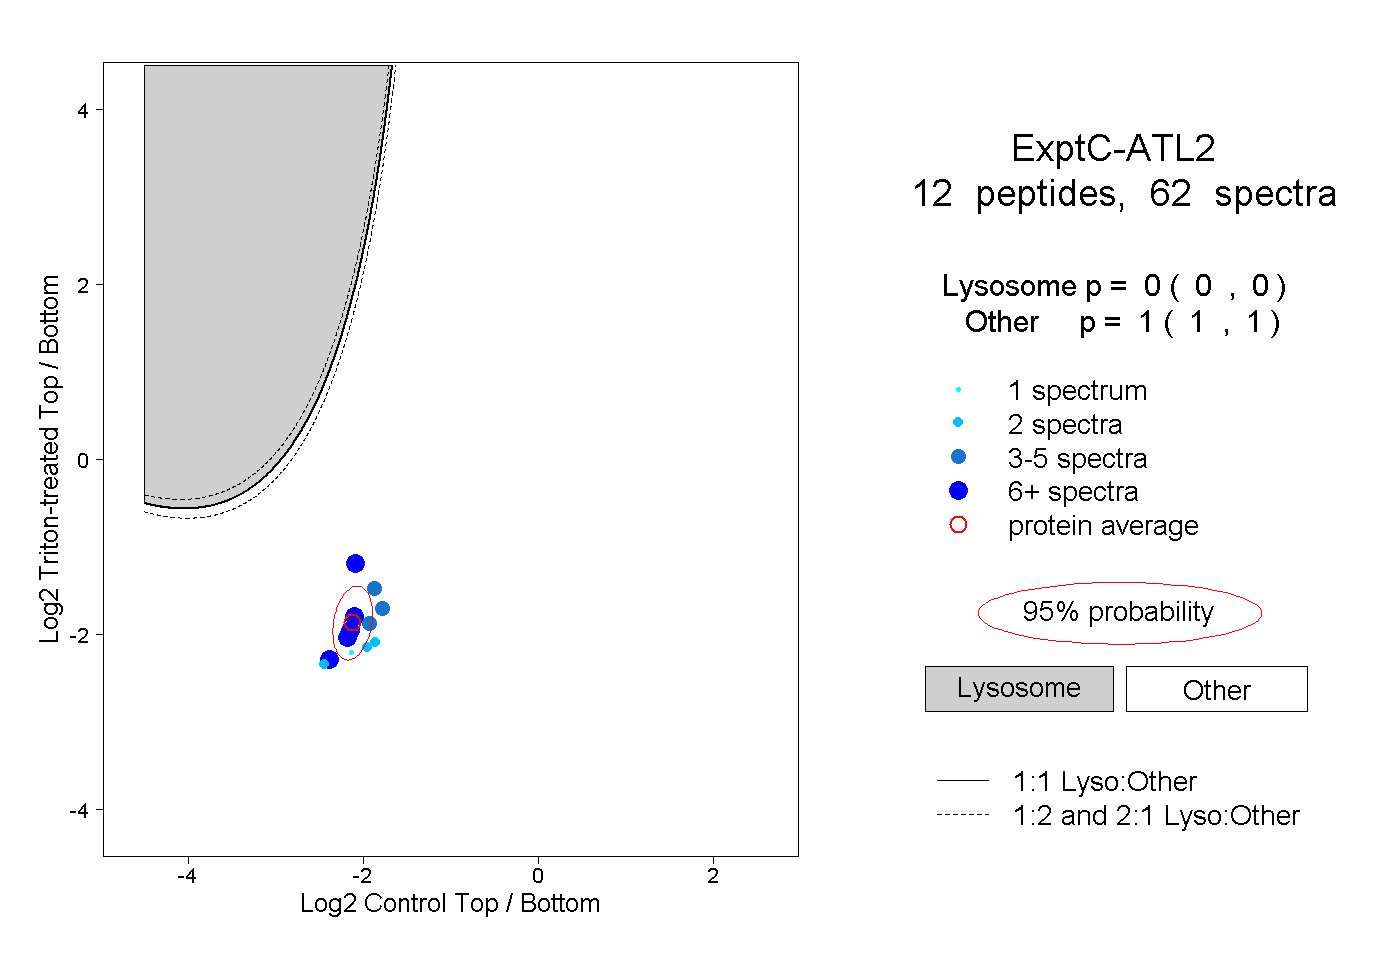 |
0.000 0.000 | 0.000 |
1.000 1.000 | 1.000 |
||||||||
| Plot | Lyso | Other | |||||||||||
| Expt D |
5 peptides |
10 spectra |
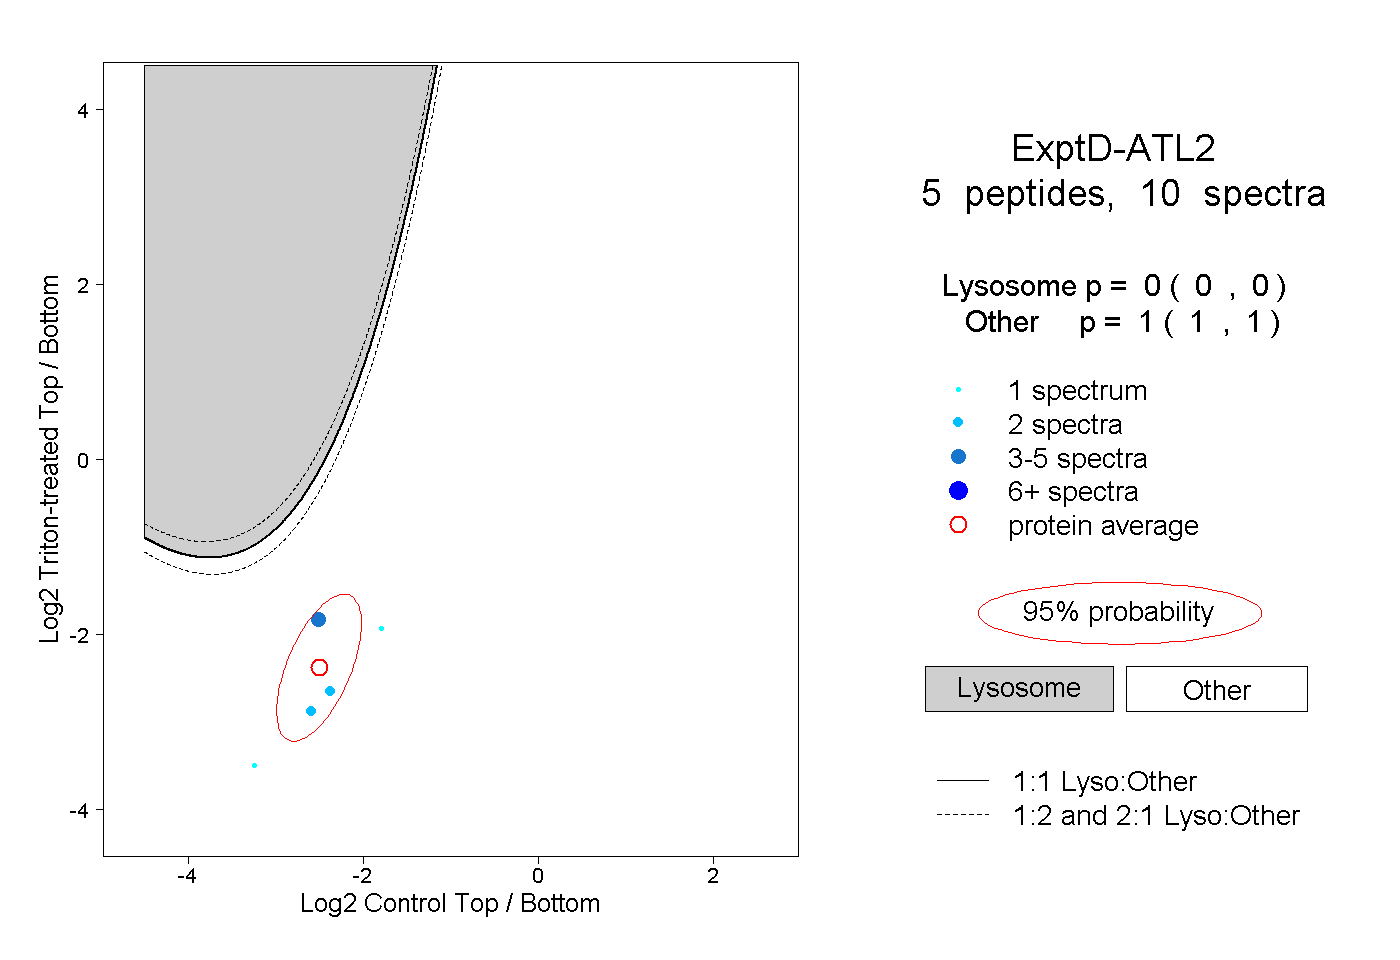 |
0.000 0.000 | 0.000 |
1.000 1.000 | 1.000 |