 4
4peptides
spectra
0.000 | 0.000
0.067 | 0.175
0.000 | 0.000
0.000 | 0.119
0.231 | 0.430
0.004 | 0.243
0.316 | 0.388
0.000 | 0.000
1peptide
spectra
0.000 | 0.000
1.000 | 1.000
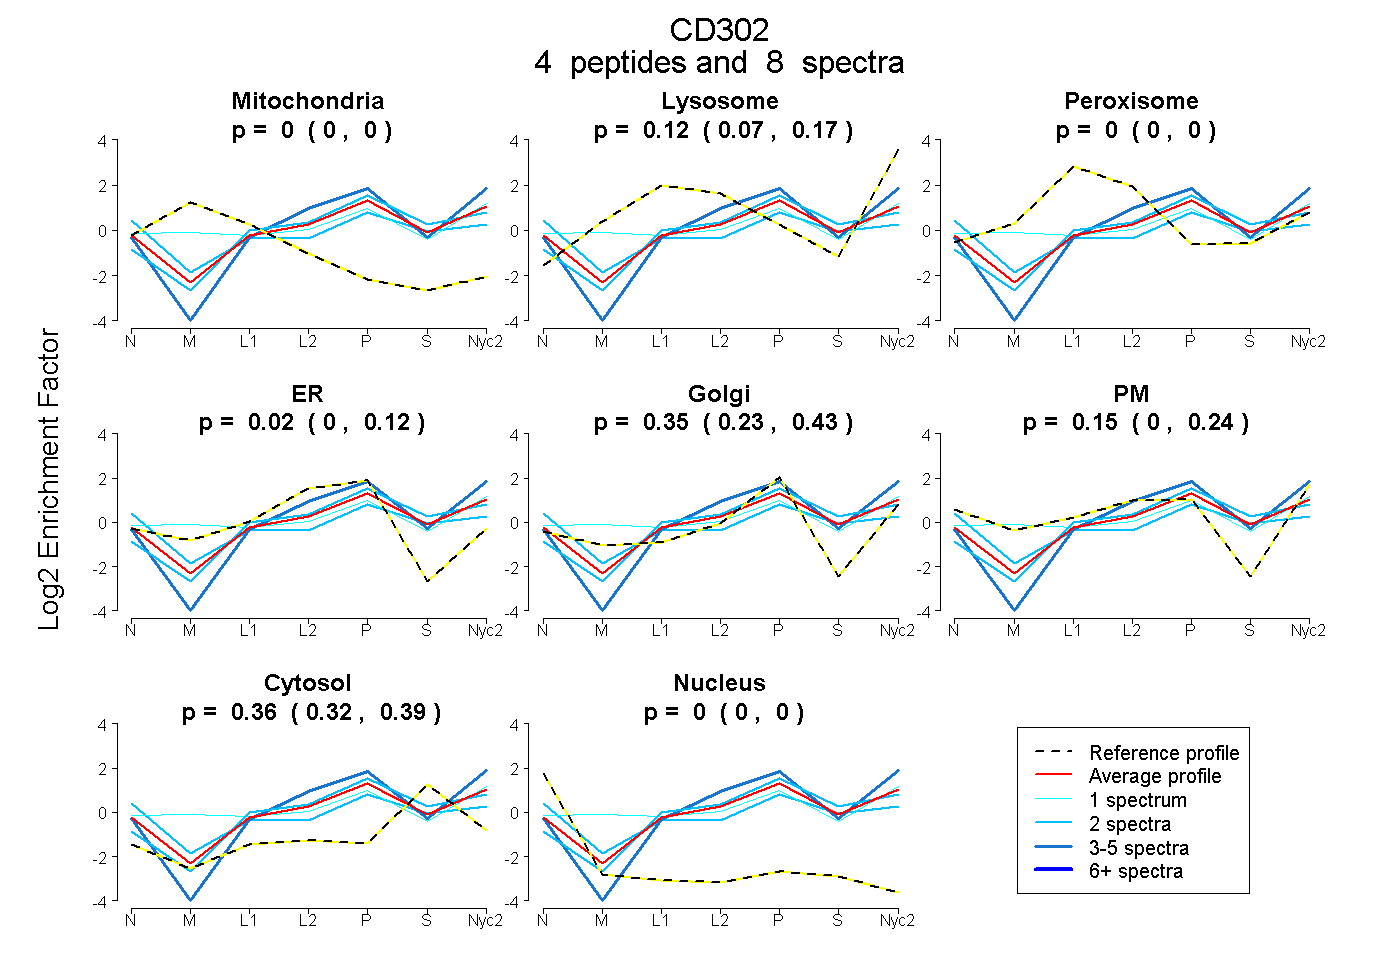
| Plot | Mito | Lyso | Perox | ER | Golgi | PM | Cytosol | Nucleus | |||||
| Expt A |
4 peptides |
8 spectra |
|
0.000 0.000 | 0.000 |
0.124 0.067 | 0.175 |
0.000 0.000 | 0.000 |
0.025 0.000 | 0.119 |
0.348 0.231 | 0.430 |
0.149 0.004 | 0.243 |
0.355 0.316 | 0.388 |
0.000 0.000 | 0.000 |
||
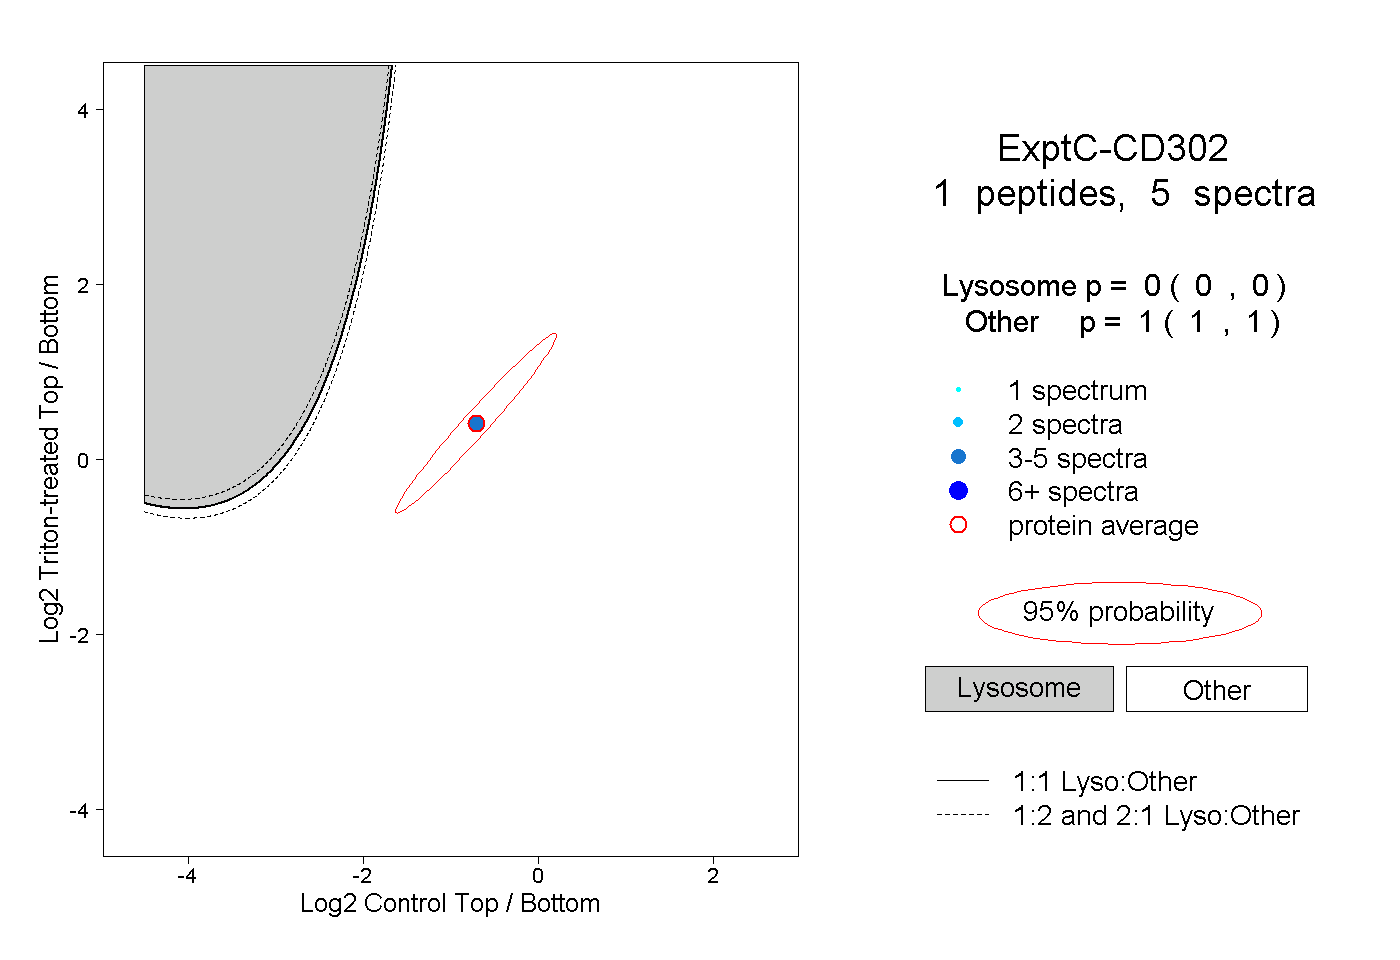
| Plot | Lyso | Other | |||||||||||
| Expt C |
1 peptide |
5 spectra |
|
0.000 0.000 | 0.000 |
1.000 1.000 | 1.000 |