RCC2
[ENSRNOP00000008940]
Main page
| | | Plot |
Mito |
Lyso |
|
Perox |
ER |
Golgi |
PM |
Cytosol |
Nucleus |
|
| Expt A |
 11
11
peptides |
31
spectra |
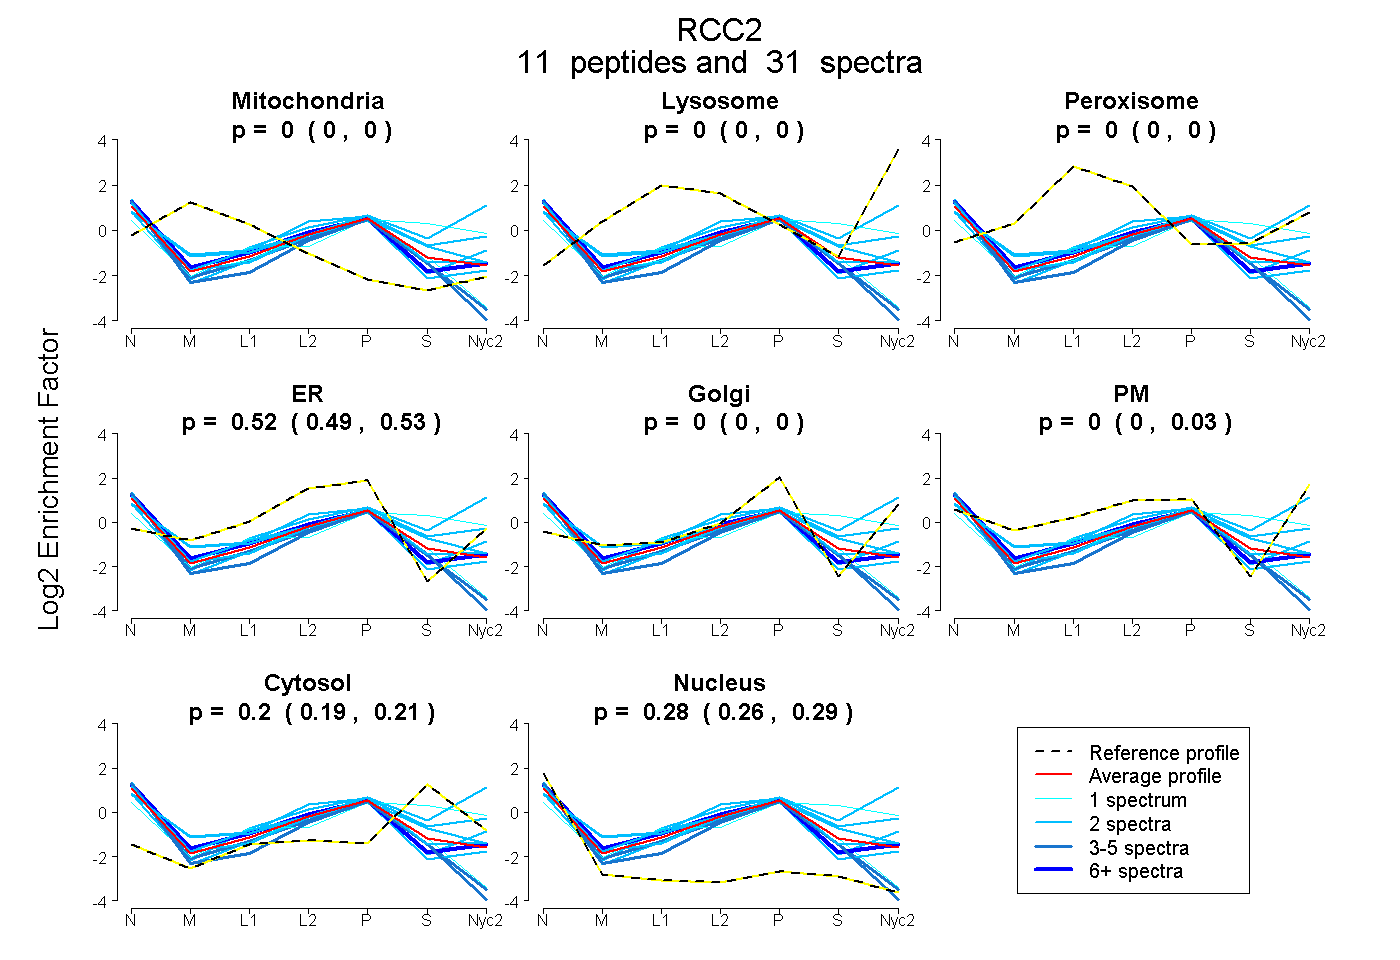 |
0.000
0.000 | 0.000 |
0.000
0.000 | 0.000 |
|
0.000
0.000 | 0.000 |
0.523
0.487 | 0.528 |
0.000
0.000 | 0.000 |
0.000
0.000 | 0.034 |
0.201
0.187 | 0.213 |
0.276
0.264 | 0.287 |
|
| | | Plot |
Mito |
|
Lyso or Perox |
|
ER |
Golgi |
PM |
Cytosol |
Nucleus |
|
| Expt B |
4
peptides |
7
spectra |
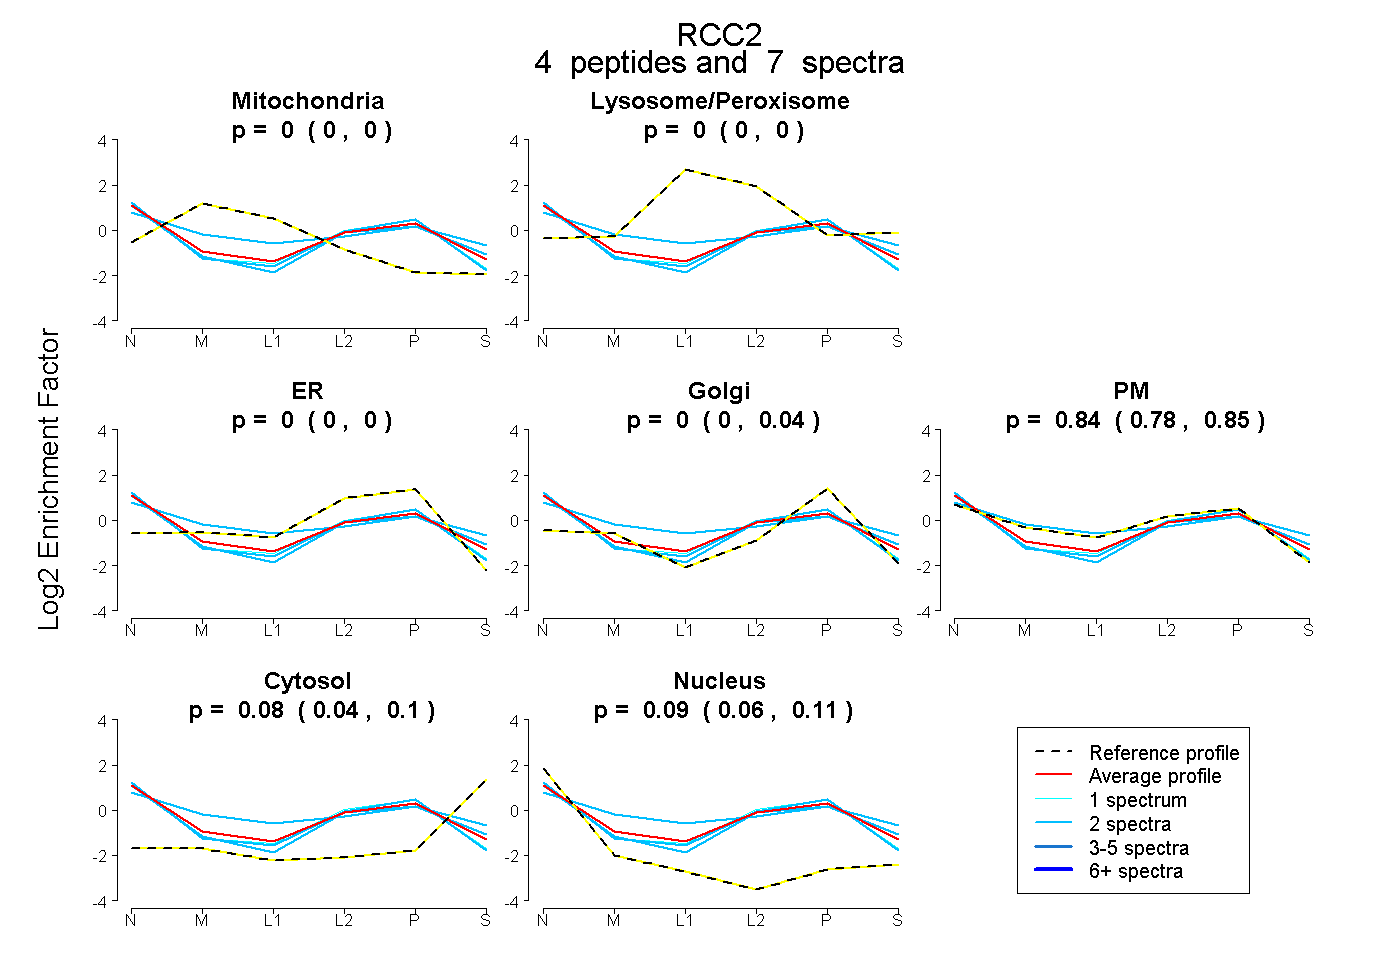 |
0.000
0.000 | 0.000 |
|
0.000
0.000 | 0.000 |
|
0.000
0.000 | 0.000 |
0.000
0.000 | 0.041 |
0.836
0.779 | 0.854 |
0.077
0.039 | 0.104 |
0.087
0.061 | 0.109 |
|
| | | Plot |
|
Lyso |
|
|
|
|
|
|
|
Other |
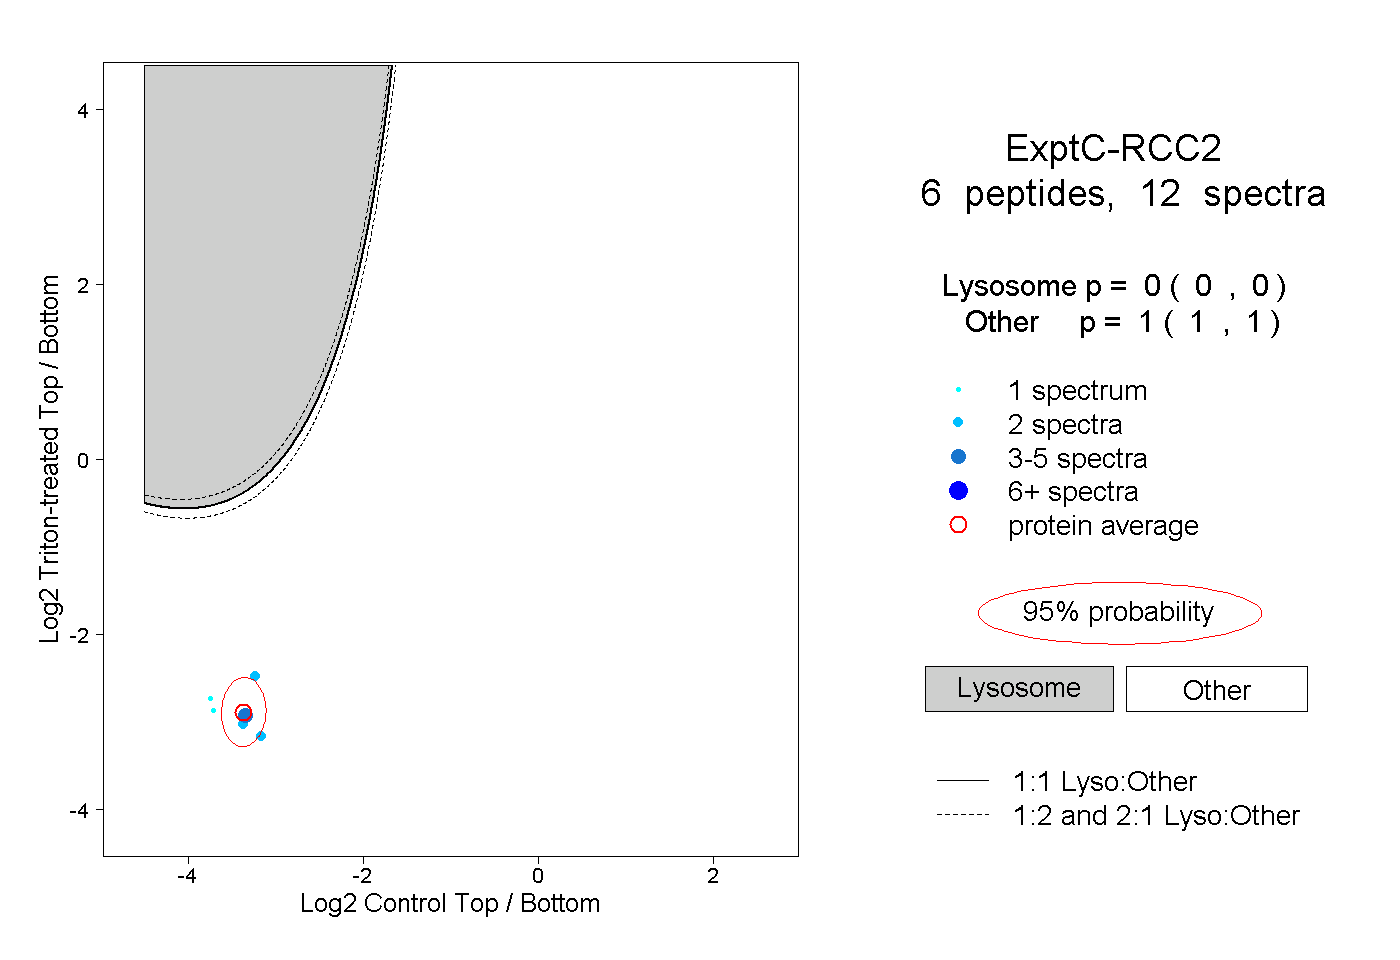
| Expt C |
6
peptides |
12
spectra |
 |
|
0.000
0.000 | 0.000 |
|
|
|
|
|
|
|
1.000
1.000 | 1.000 |
| 2 spectra, LFDFPGR |
|
0.000 |
|
|
|
|
|
|
|
1.000 |
| 4 spectra, SSTAAQEVK |
|
0.000 |
|
|
|
|
|
|
|
1.000 |
| 1 spectrum, LPEYTPR |
|
0.000 |
|
|
|
|
|
|
|
1.000 |
| 2 spectra, IEYDCELVPR |
|
0.000 |
|
|
|
|
|
|
|
1.000 |
| 2 spectra, SLACGK |
|
0.000 |
|
|
|
|
|
|
|
1.000 |
| 1 spectrum, AVQDLCGWR |
|
0.000 |
|
|
|
|
|
|
|
1.000 |
| | | Plot |
|
Lyso |
|
|
|
|
|
|
|
Other |
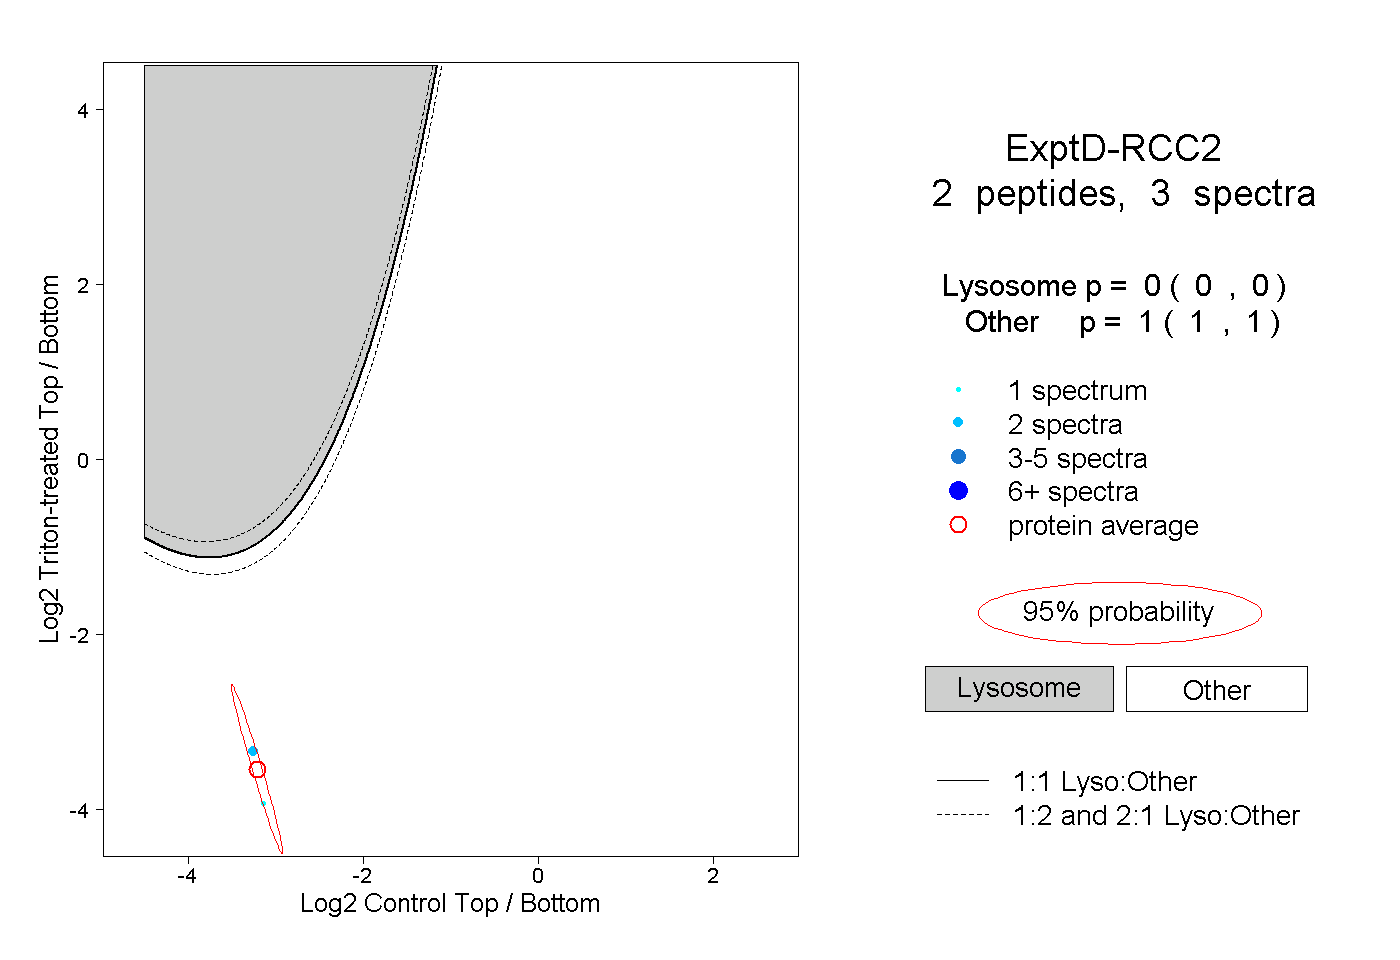
| Expt D |
2
peptides |
3
spectra |
 |
|
0.000
0.000 | 0.000 |
|
|
|
|
|
|
|
1.000
1.000 | 1.000 |