 3
3peptides
spectra
0.000 | 0.000
0.000 | 0.081
0.000 | 0.073
0.000 | 0.069
0.000 | 0.022
0.173 | 0.326
0.617 | 0.739
0.000 | 0.000
2peptides
spectra
0.000 | 0.013
0.986 | 1.000
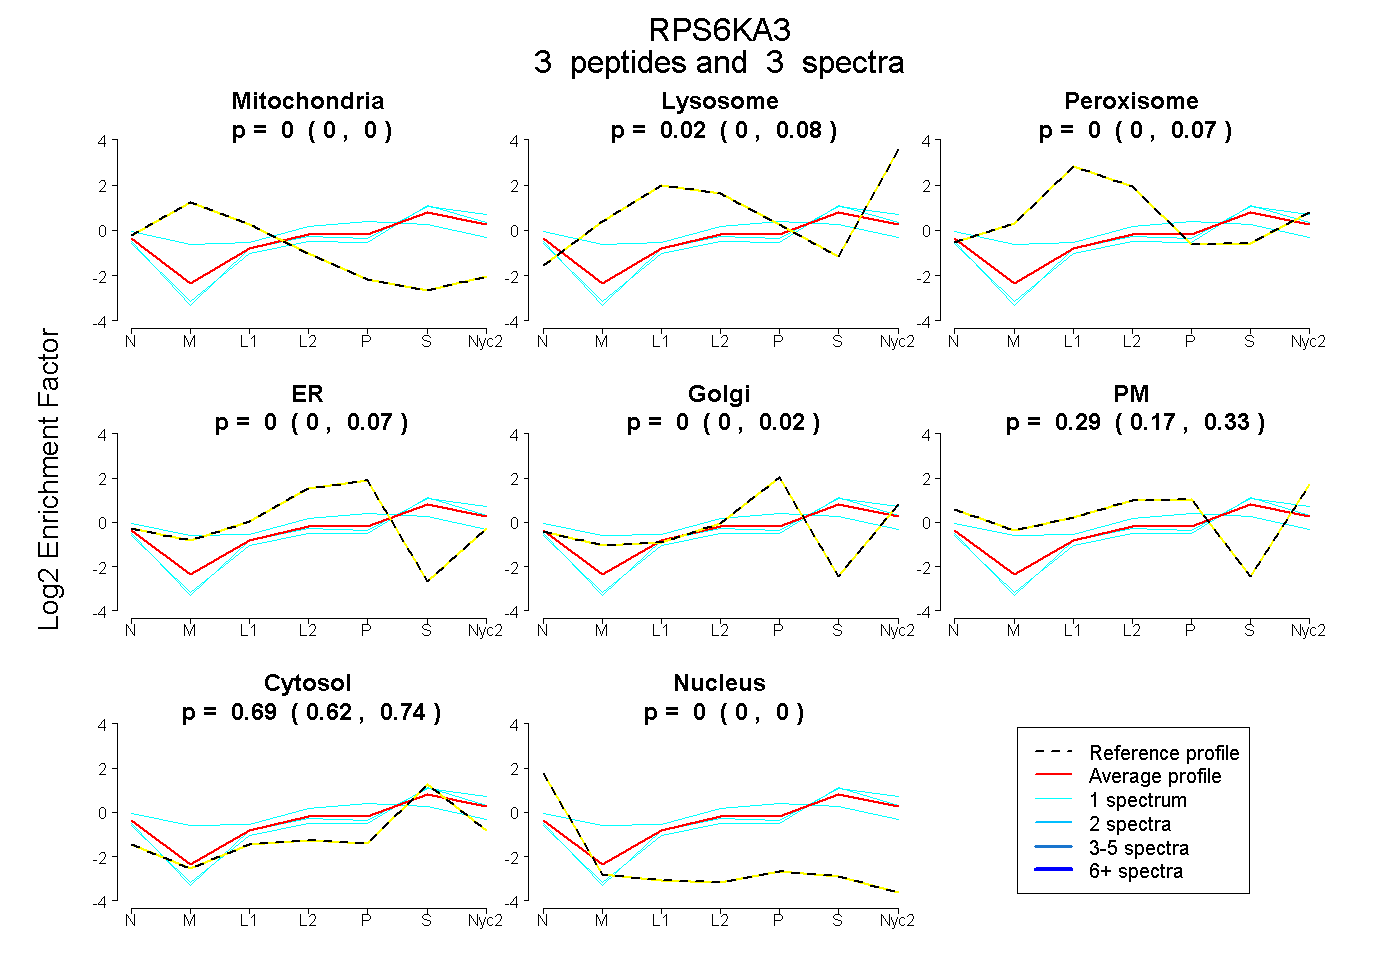
| Plot | Mito | Lyso | Perox | ER | Golgi | PM | Cytosol | Nucleus | |||||
| Expt A |
3 peptides |
3 spectra |
|
0.000 0.000 | 0.000 |
0.021 0.000 | 0.081 |
0.001 0.000 | 0.073 |
0.000 0.000 | 0.069 |
0.000 0.000 | 0.022 |
0.292 0.173 | 0.326 |
0.686 0.617 | 0.739 |
0.000 0.000 | 0.000 |
||
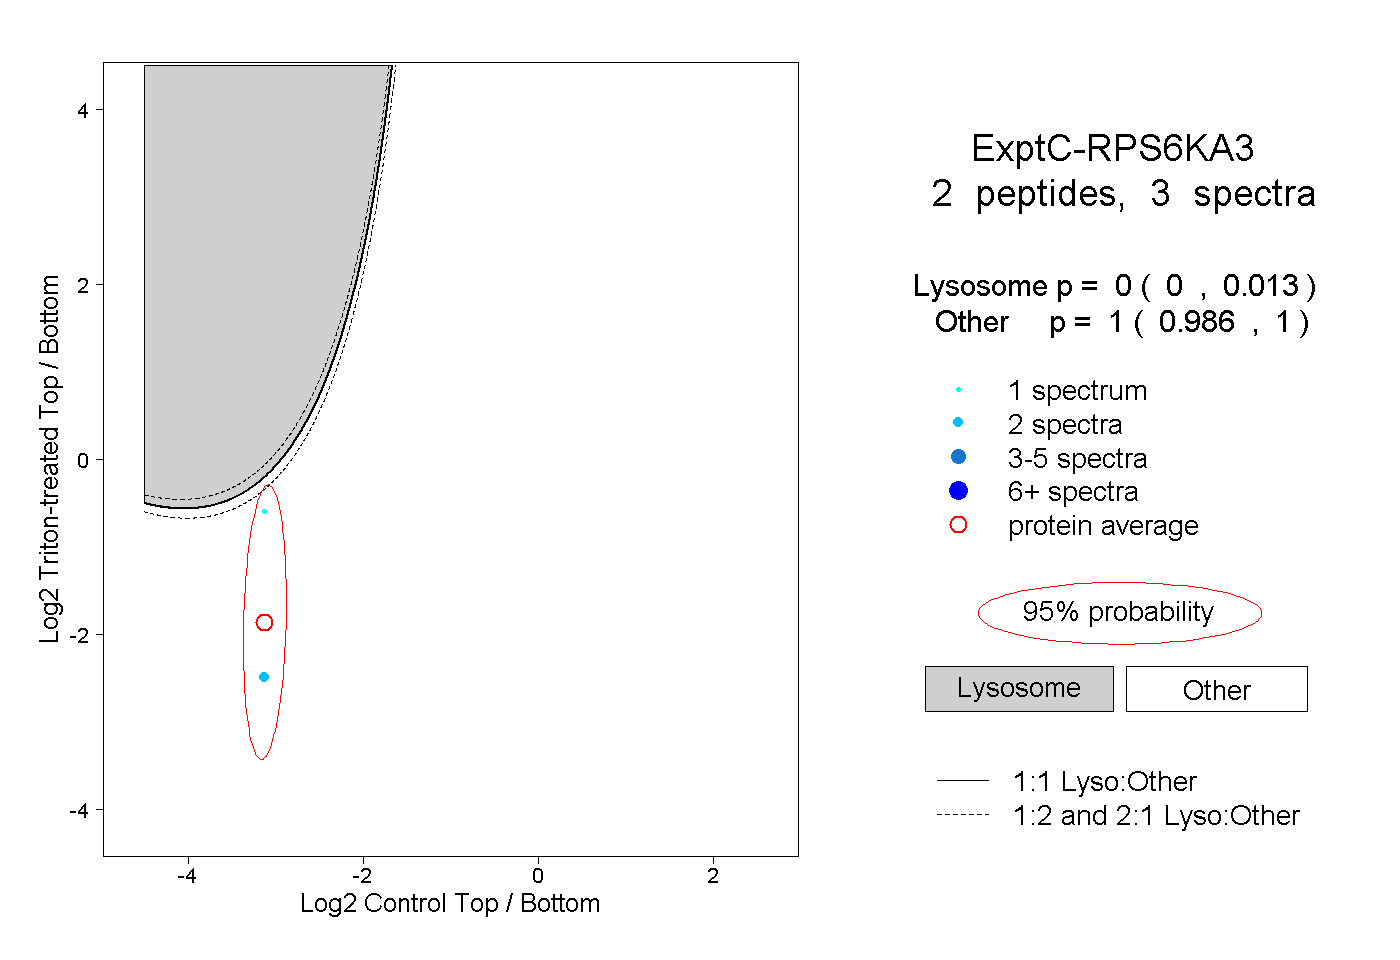
| Plot | Lyso | Other | |||||||||||
| Expt C |
2 peptides |
3 spectra |
|
0.000 0.000 | 0.013 |
1.000 0.986 | 1.000 |