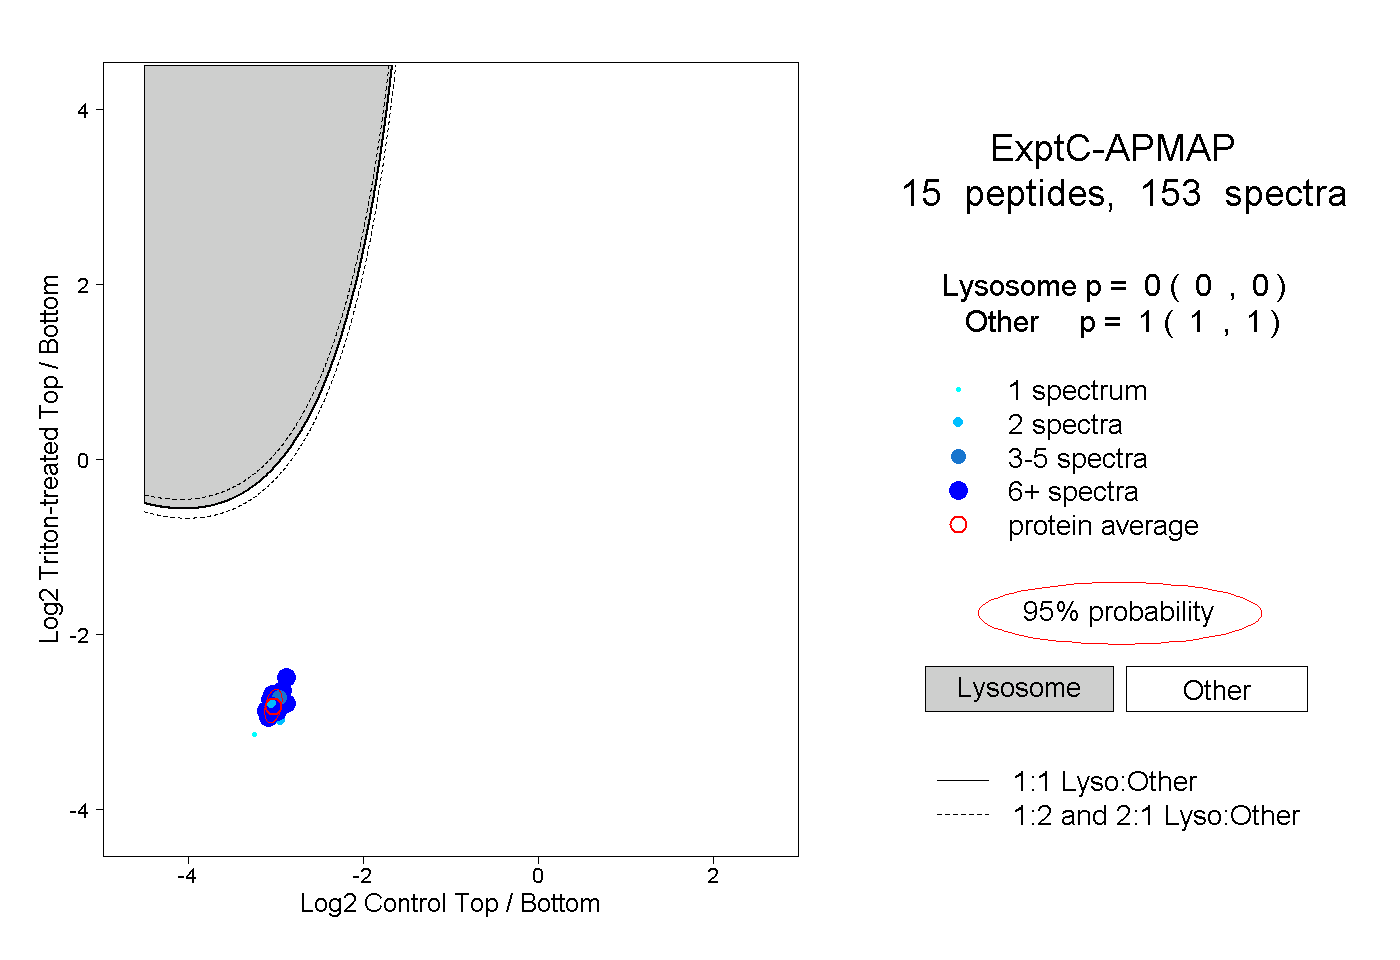
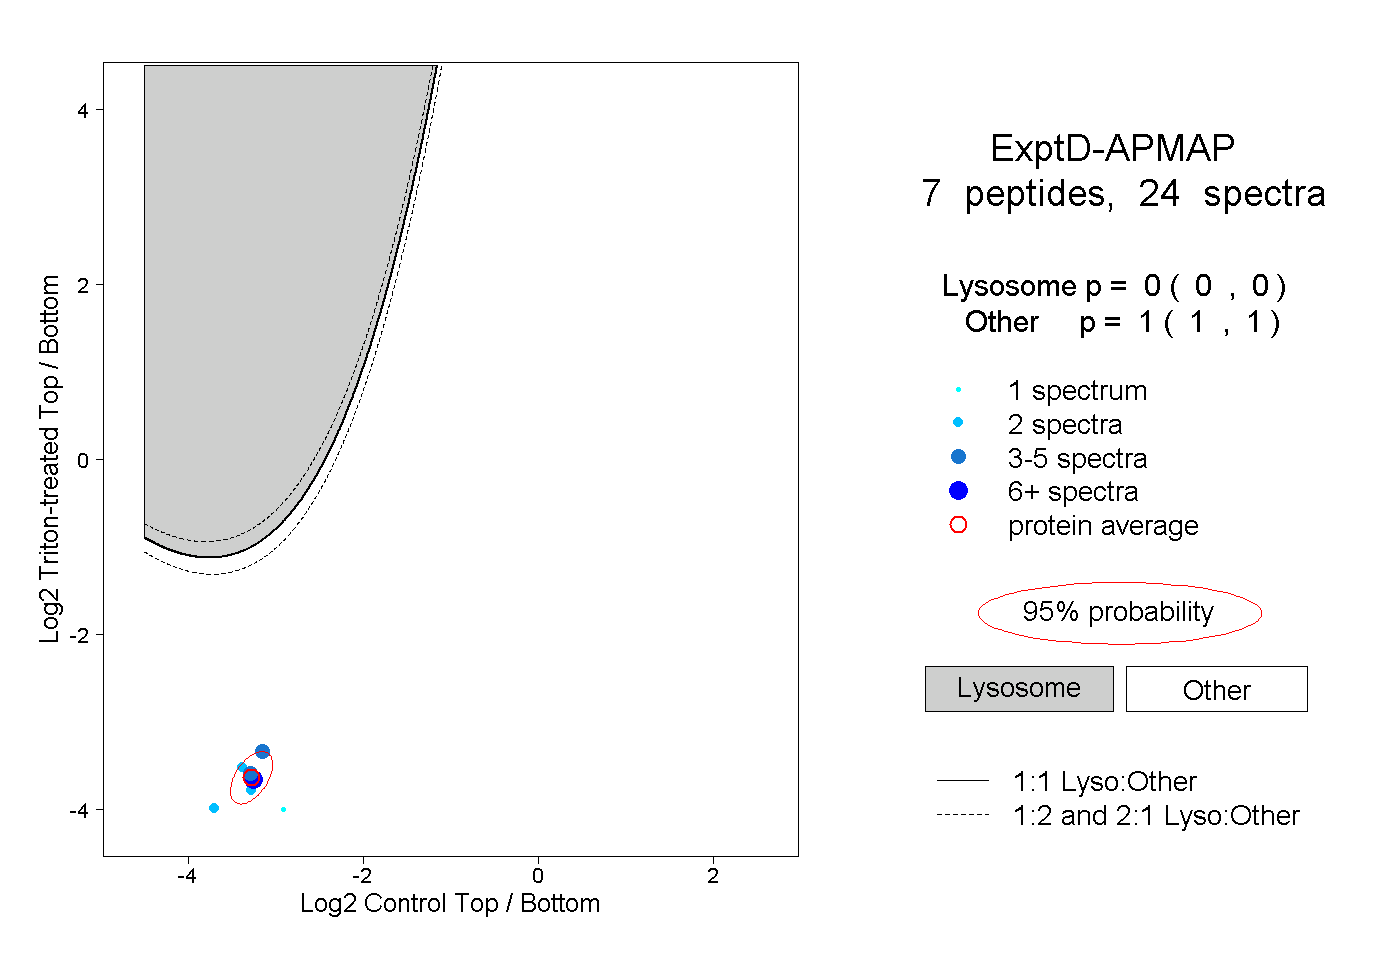
14
14peptides
spectra
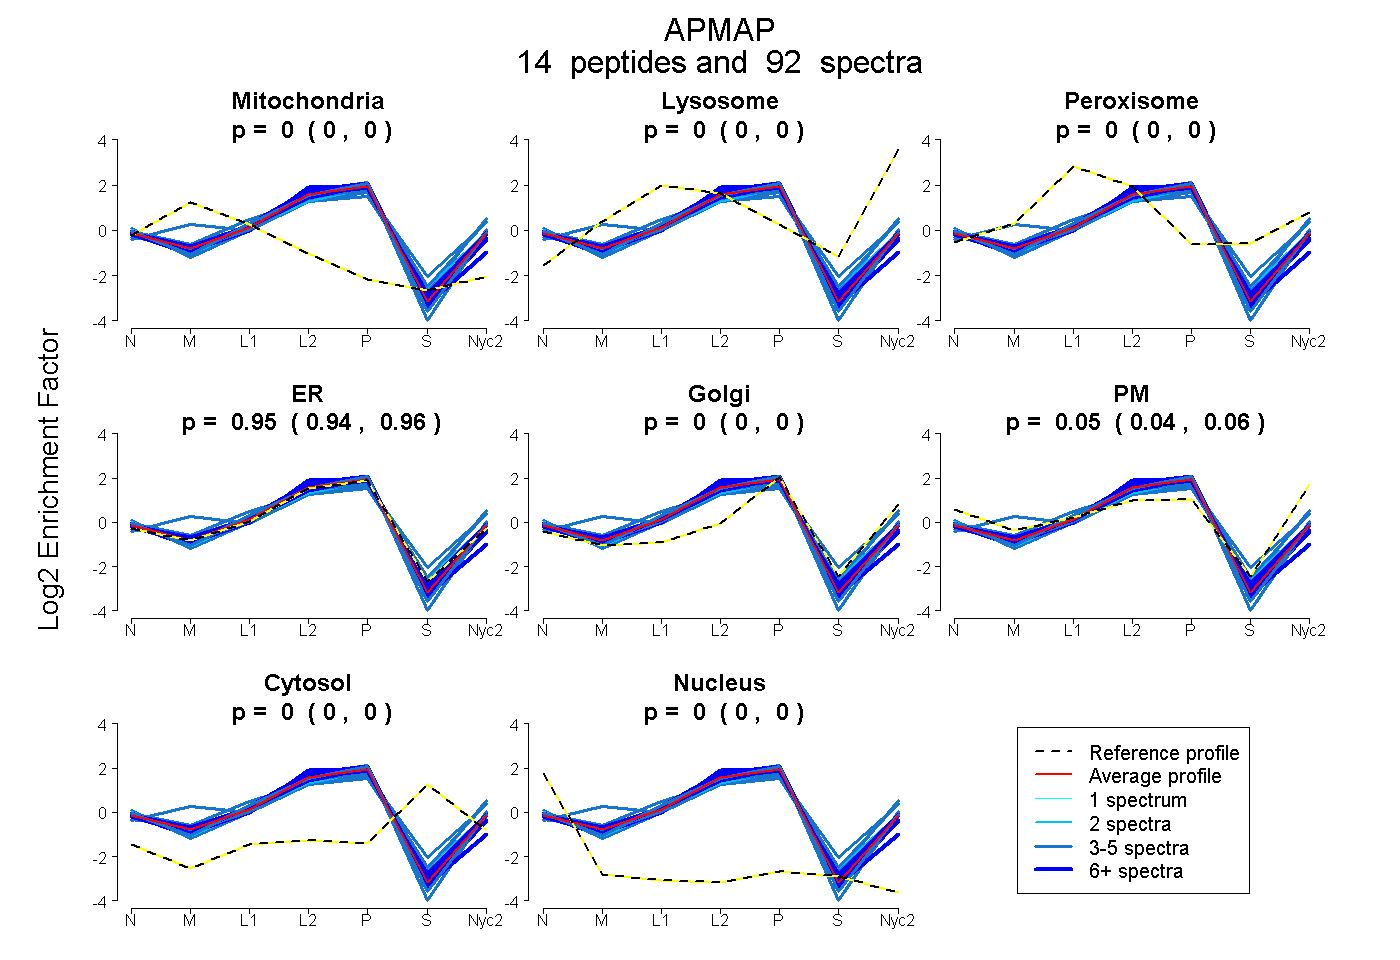
0.000 | 0.000
0.000 | 0.000
0.000 | 0.000
0.943 | 0.957
0.000 | 0.000
0.041 | 0.055
0.000 | 0.000
0.000 | 0.000
10peptides
spectra
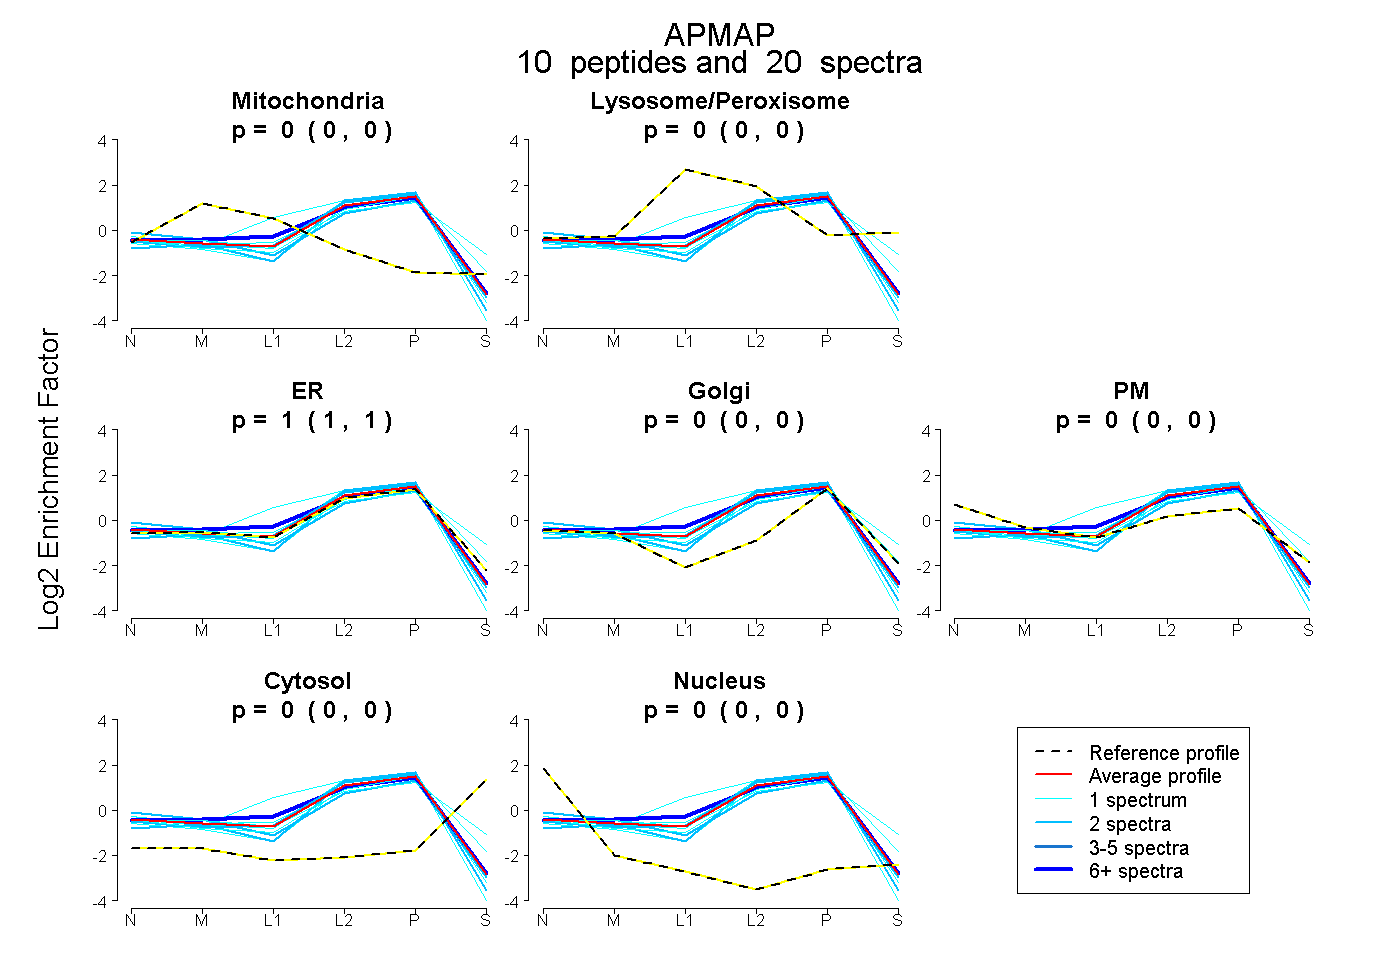
0.000 | 0.000
0.000 | 0.000
1.000 | 1.000
0.000 | 0.000
0.000 | 0.000
0.000 | 0.000
0.000 | 0.000